Fig. 2
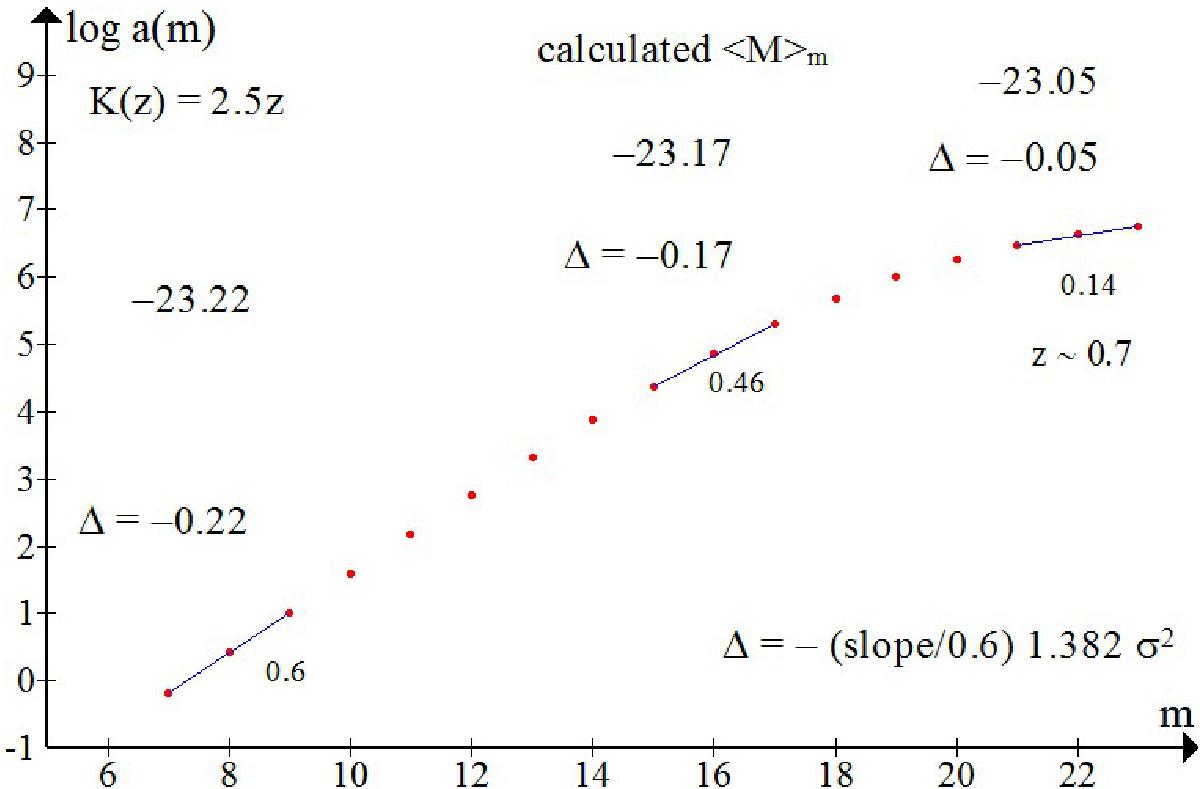
log a(m) vs. finite-band apparent magnitude m for a Gaussian standard candle. Here the K-effect needed in the calculations of a(m) and the average absolute magnitude ⟨ M ⟩ m corresponds to the correction K(z) = 2.5z. Other parameters have the same values as in Fig. 1. This and Fig. 1 also show roughly where the redshift distribution peaks around m = 22 mag.
Current usage metrics show cumulative count of Article Views (full-text article views including HTML views, PDF and ePub downloads, according to the available data) and Abstracts Views on Vision4Press platform.
Data correspond to usage on the plateform after 2015. The current usage metrics is available 48-96 hours after online publication and is updated daily on week days.
Initial download of the metrics may take a while.