Fig. 1
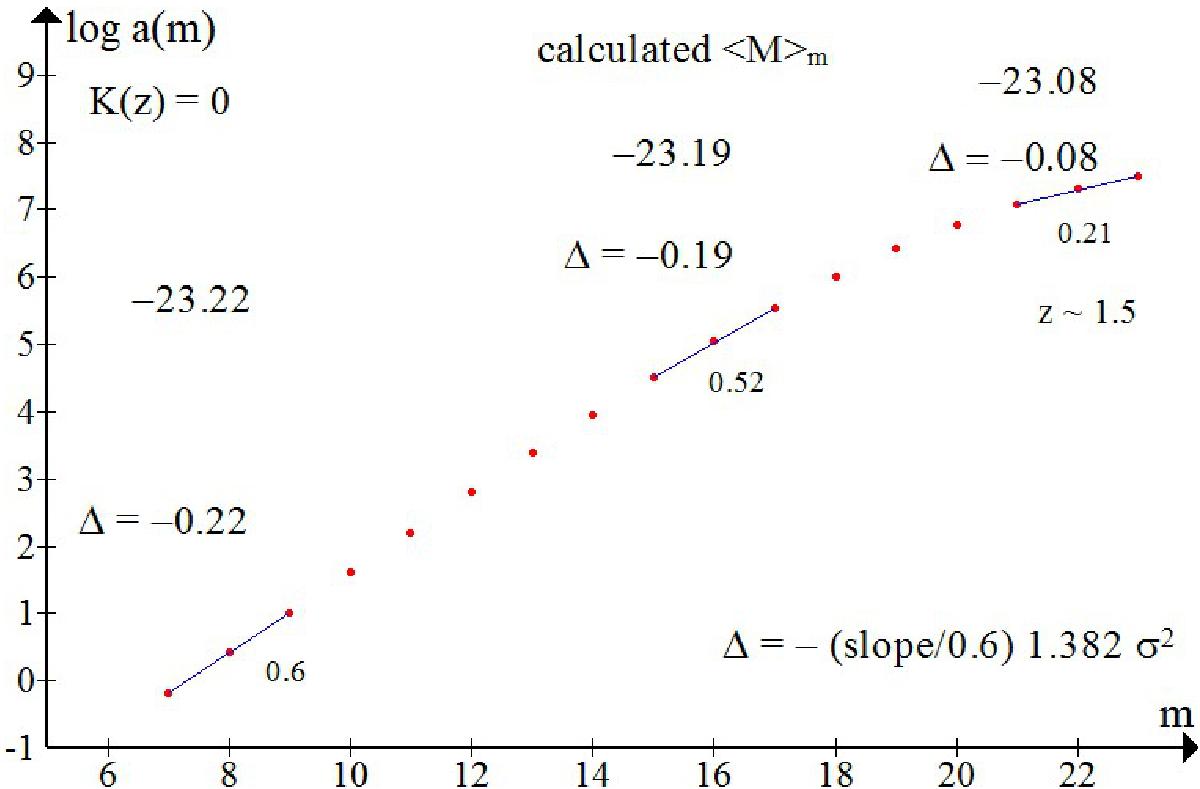
log a(m) vs. bolometric magnitude m (Eq.(4)) for a standard candle with M0 = −23.0 and σM = 0.4 mag (the E-deS model, see text). The upper figures above the curve are the mean values ⟨ M ⟩ m calculated from Eq. (6) for m = 8, 16 and 22 mag, respectively. The lower figures (Δ) are the Malmquist bias values as calculated from the slopes shown below the curve.
Current usage metrics show cumulative count of Article Views (full-text article views including HTML views, PDF and ePub downloads, according to the available data) and Abstracts Views on Vision4Press platform.
Data correspond to usage on the plateform after 2015. The current usage metrics is available 48-96 hours after online publication and is updated daily on week days.
Initial download of the metrics may take a while.