Fig. 6
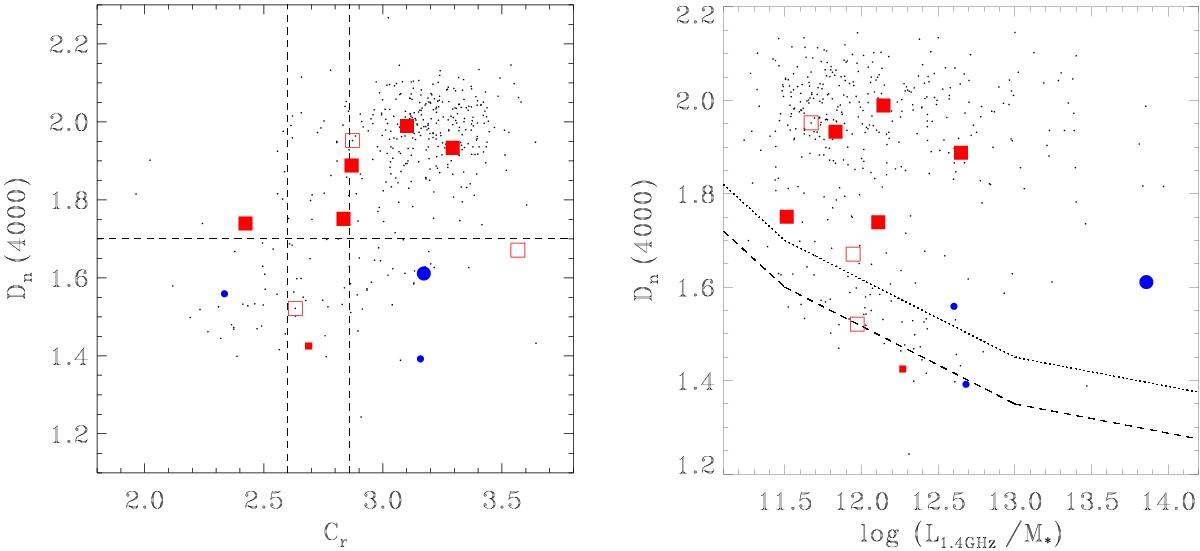
Left panel: concentration index in the r band, Cr, versus the Dn(4000) index. The vertical lines correspond to the two definitions of ETGs (Cr> 2.86 or 2.60, see text for details), while the horizontal line separates blue from red sources. Right panel: Dn(4000) versus L1.4 GHz/M∗. The dashed curve is the empirical separation between the star-forming and AGN radio-emitting sources performed by Best et al. (2005; read the text for details). The dotted curve is shifted by 0.1 above in Dn(4000) of the dashed curve to separate the objects with a possible star-formation contribution to their radio emission. The small dot points correspond to the SDSS/NVSS sample studied by Baldi & Capetti (2010). The different color/shape symbols correspond to the different classes like in Fig. 1.
Current usage metrics show cumulative count of Article Views (full-text article views including HTML views, PDF and ePub downloads, according to the available data) and Abstracts Views on Vision4Press platform.
Data correspond to usage on the plateform after 2015. The current usage metrics is available 48-96 hours after online publication and is updated daily on week days.
Initial download of the metrics may take a while.