Fig. 2
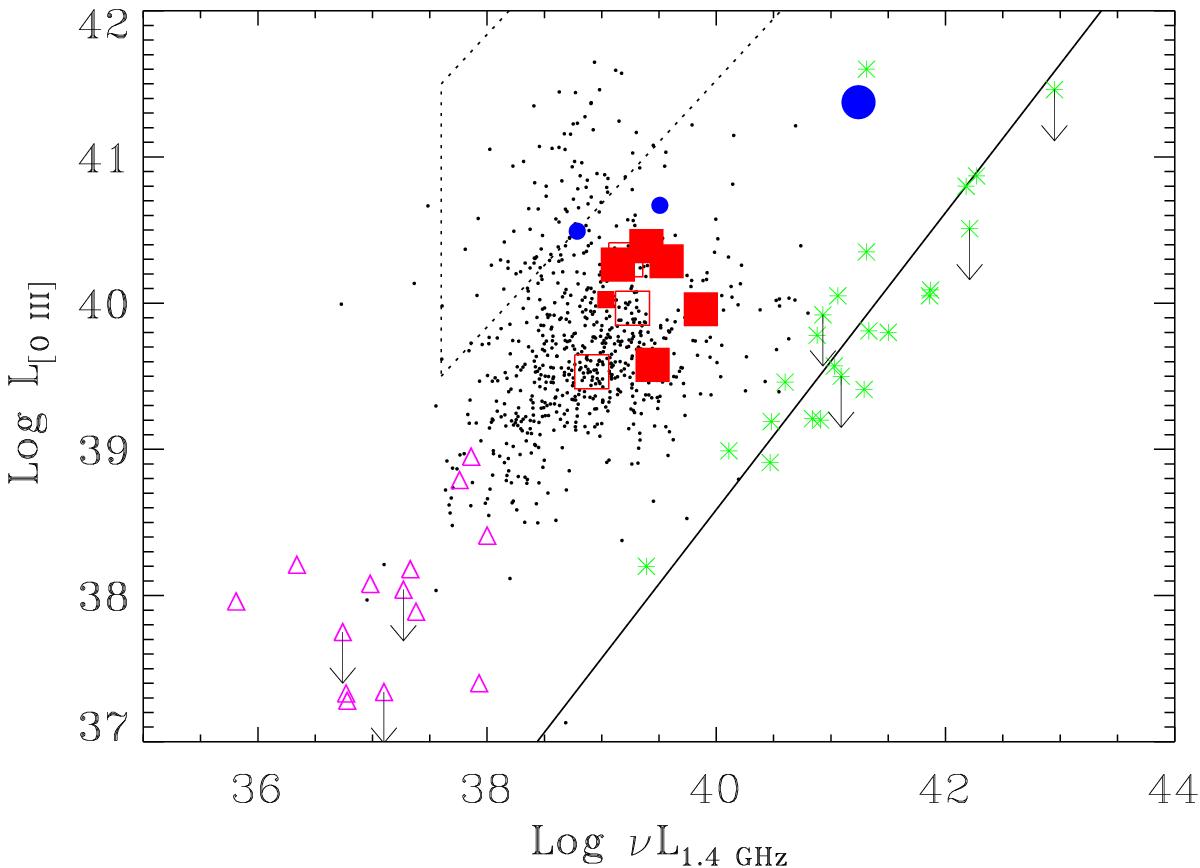
FIRST vs. [O III] line luminosity (erg s-1). The colored points represent the 12 galaxies observed with the JVLA coded as in Fig. 1. The small dot points correspond to the SDSS/NVSS sample studied by Baldi & Capetti (2010). The solid line represents the correlation between line and radio-luminosity derived for the 3CR/FR I sample. The dotted lines include the region where Seyfert galaxies are found. The empty pink triangles are the CoreG, and green stars the 3CR/FR Is.
Current usage metrics show cumulative count of Article Views (full-text article views including HTML views, PDF and ePub downloads, according to the available data) and Abstracts Views on Vision4Press platform.
Data correspond to usage on the plateform after 2015. The current usage metrics is available 48-96 hours after online publication and is updated daily on week days.
Initial download of the metrics may take a while.