Fig. 9
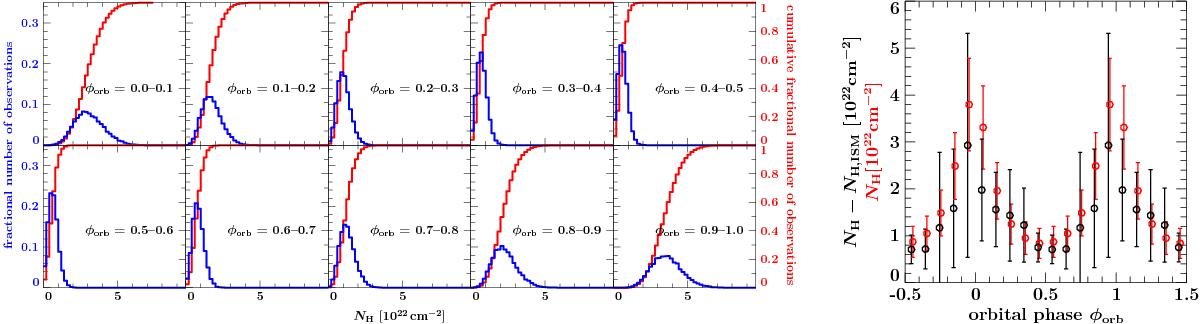
Predictions of NH variability assuming a clumpy wind model with the total number of clumps per flow time N = 1000 and the terminal porosity length h∞ = R∗ (see Sect. 4.1.3 for explanation of parameters). Left: model histograms for the distribution of equivalent absorption column density NH. Right: average values (circles) and standard deviations (error bars on the average values) in a given orbital phase for the theoretical model (red) and values measured in the hard state of MJD 53 900−55 375 (black). Average measured values are shown as “average − NH,ISM” to account for the ISM absorption.
Current usage metrics show cumulative count of Article Views (full-text article views including HTML views, PDF and ePub downloads, according to the available data) and Abstracts Views on Vision4Press platform.
Data correspond to usage on the plateform after 2015. The current usage metrics is available 48-96 hours after online publication and is updated daily on week days.
Initial download of the metrics may take a while.