Fig. 7
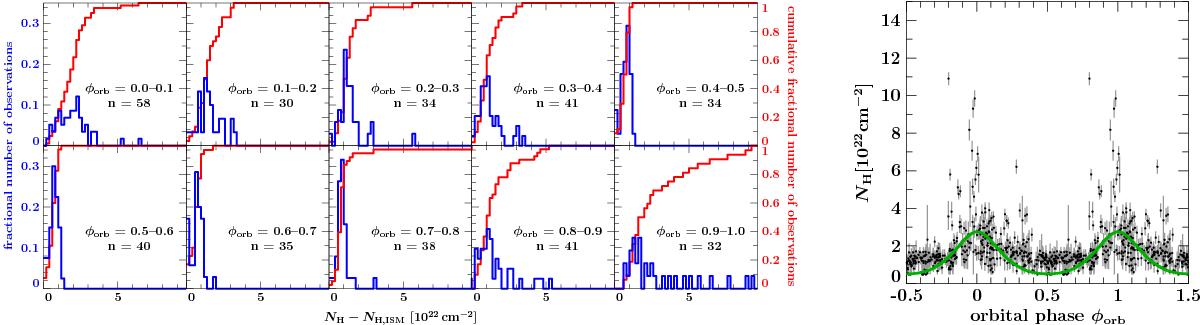
Observations from the hard state of 2006–2010 (MJD 53 900–55 375, Grinberg et al. 2013) that do not require a disk. Left: normalized histograms (blue) and normalized cumulative histograms (red) for NH above the ISM value for individual orbital phase bins; n denotes the total number of observations in a given orbital phase bin. We note that the phase bin φorb = 0.7 − 0.8 contains one measurement in excess of 1023 cm-2. Right: orbital dependence of NH. The best fit focussed wind model introduced in Sect. 4.1.2 is shown in green.
Current usage metrics show cumulative count of Article Views (full-text article views including HTML views, PDF and ePub downloads, according to the available data) and Abstracts Views on Vision4Press platform.
Data correspond to usage on the plateform after 2015. The current usage metrics is available 48-96 hours after online publication and is updated daily on week days.
Initial download of the metrics may take a while.