Free Access
Fig. 7
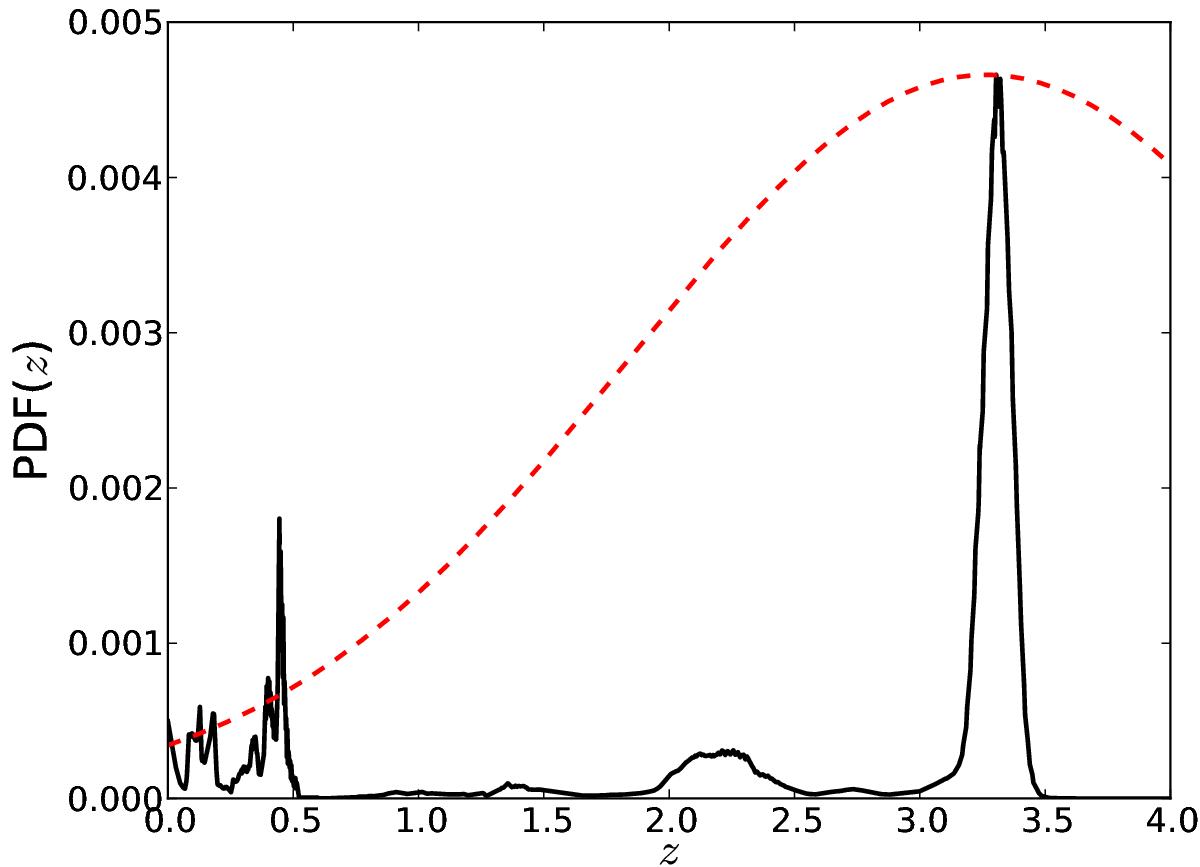
Redshift probability distribution of a galaxy with a significant probability at both high and low redshift (black line). Overplotted is the corresponding Gaussian approximation of the distribution (dashed red line). (A colour version of this figure is available in the online edition.)
Current usage metrics show cumulative count of Article Views (full-text article views including HTML views, PDF and ePub downloads, according to the available data) and Abstracts Views on Vision4Press platform.
Data correspond to usage on the plateform after 2015. The current usage metrics is available 48-96 hours after online publication and is updated daily on week days.
Initial download of the metrics may take a while.