Fig. 6
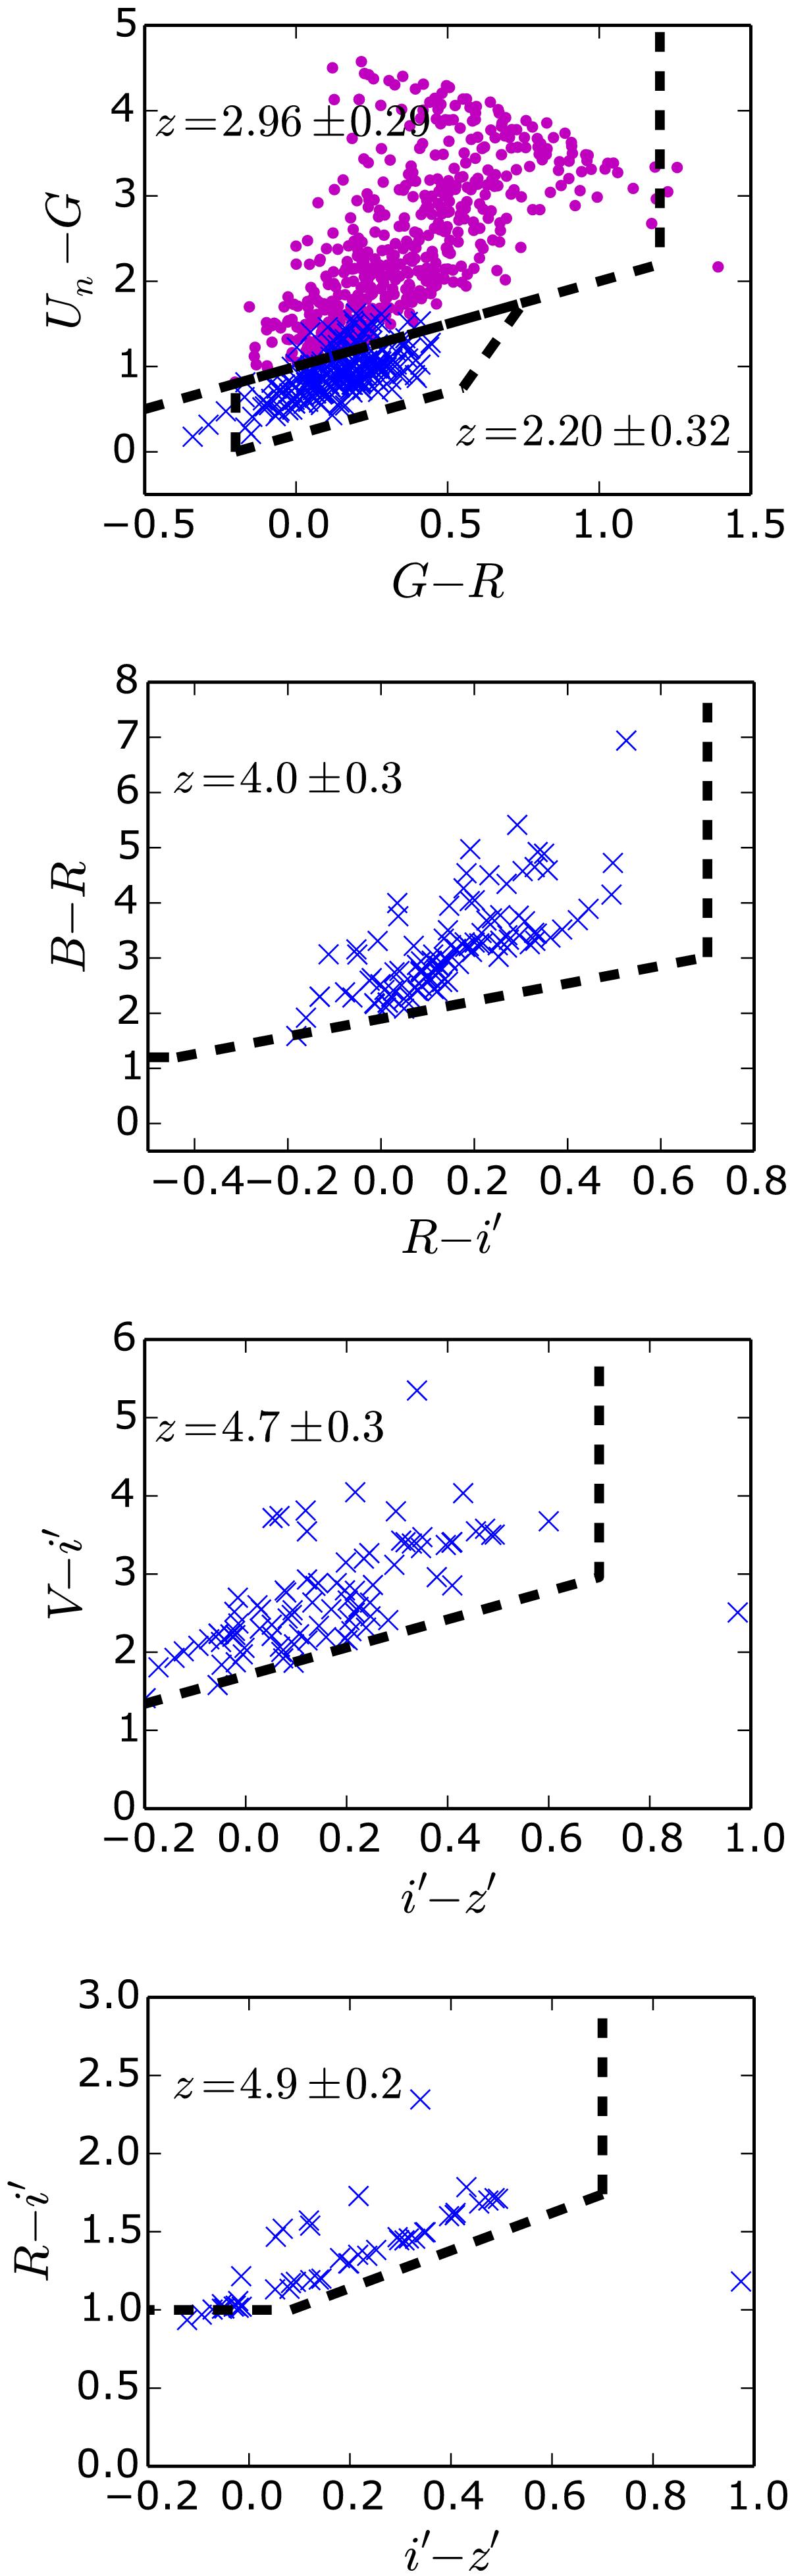
Locations of our clean sample candidates in four colour–colour diagrams used for traditional dropout selections. The selection boxes in each diagram are shown with dashed lines and the redshift ranges they target are indicated in each panel. We only plot the candidates in the redshift range within 1σ of the one targeted by these diagrams (blue crosses). In the top diagram the blue crosses refer to the BX selection while the magenta dots to the LBG selection. See the text for more details. (A colour version of this figure is available in the online edition.)
Current usage metrics show cumulative count of Article Views (full-text article views including HTML views, PDF and ePub downloads, according to the available data) and Abstracts Views on Vision4Press platform.
Data correspond to usage on the plateform after 2015. The current usage metrics is available 48-96 hours after online publication and is updated daily on week days.
Initial download of the metrics may take a while.