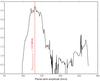
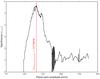
Fig. 2

Detection significance as a function of kPlanet. The red line corresponds to the kPlanet value for maximum detection. The maximum detection occurs for similar kPlanet values for both templates. The amplitude values set to zero corresponds to kPlanet values for which no Gaussian fit with our restrictions could be achieved. Left panel: using template #1; right panel: using template #2.
Current usage metrics show cumulative count of Article Views (full-text article views including HTML views, PDF and ePub downloads, according to the available data) and Abstracts Views on Vision4Press platform.
Data correspond to usage on the plateform after 2015. The current usage metrics is available 48-96 hours after online publication and is updated daily on week days.
Initial download of the metrics may take a while.