Fig. 9
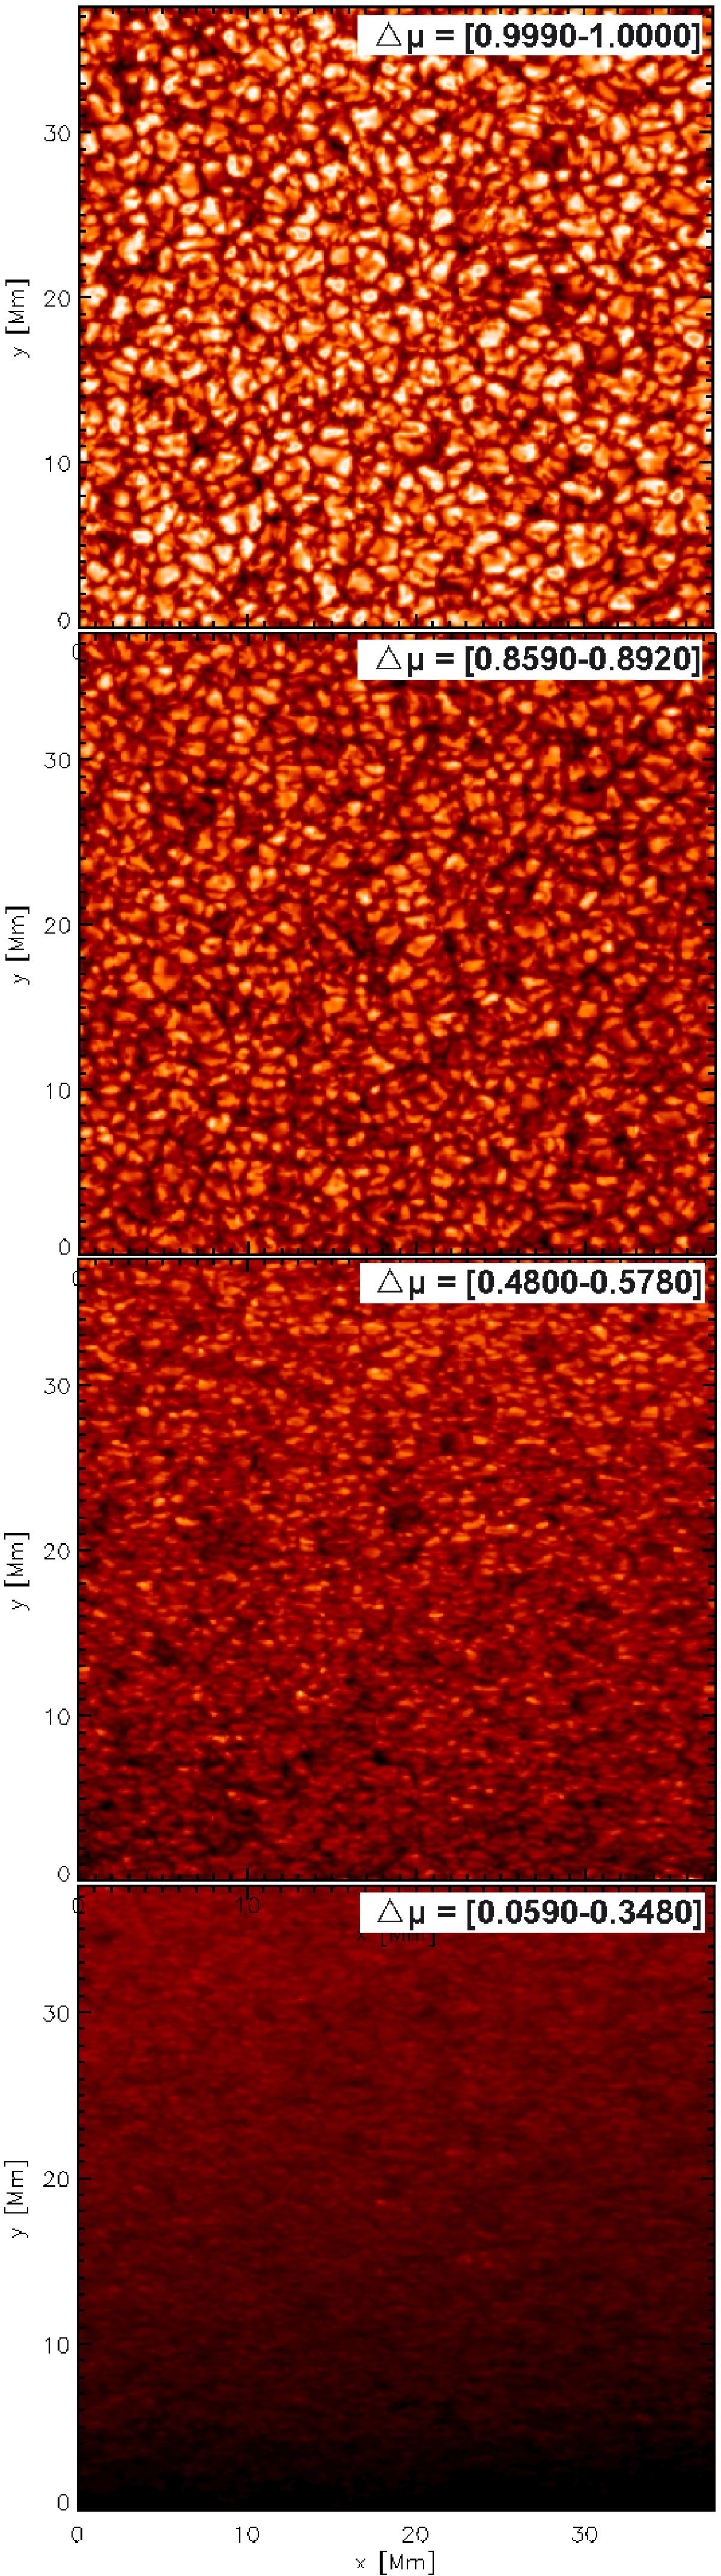
Total solar intensity image (370 × 370 pixels) as seen by the Hinode SOT/SP spectropolarimeter at different Δμ and at continuum wavelengths close to 6300 Å. Top panel: center of the Sun, bottom panel: southern limb. The intensity range is, from the top, 18–27 × 103, 17–27 × 103, 14–21 × 103, and 18–25 × 103 DN pixel-1 s-1.
Current usage metrics show cumulative count of Article Views (full-text article views including HTML views, PDF and ePub downloads, according to the available data) and Abstracts Views on Vision4Press platform.
Data correspond to usage on the plateform after 2015. The current usage metrics is available 48-96 hours after online publication and is updated daily on week days.
Initial download of the metrics may take a while.