Fig. 8
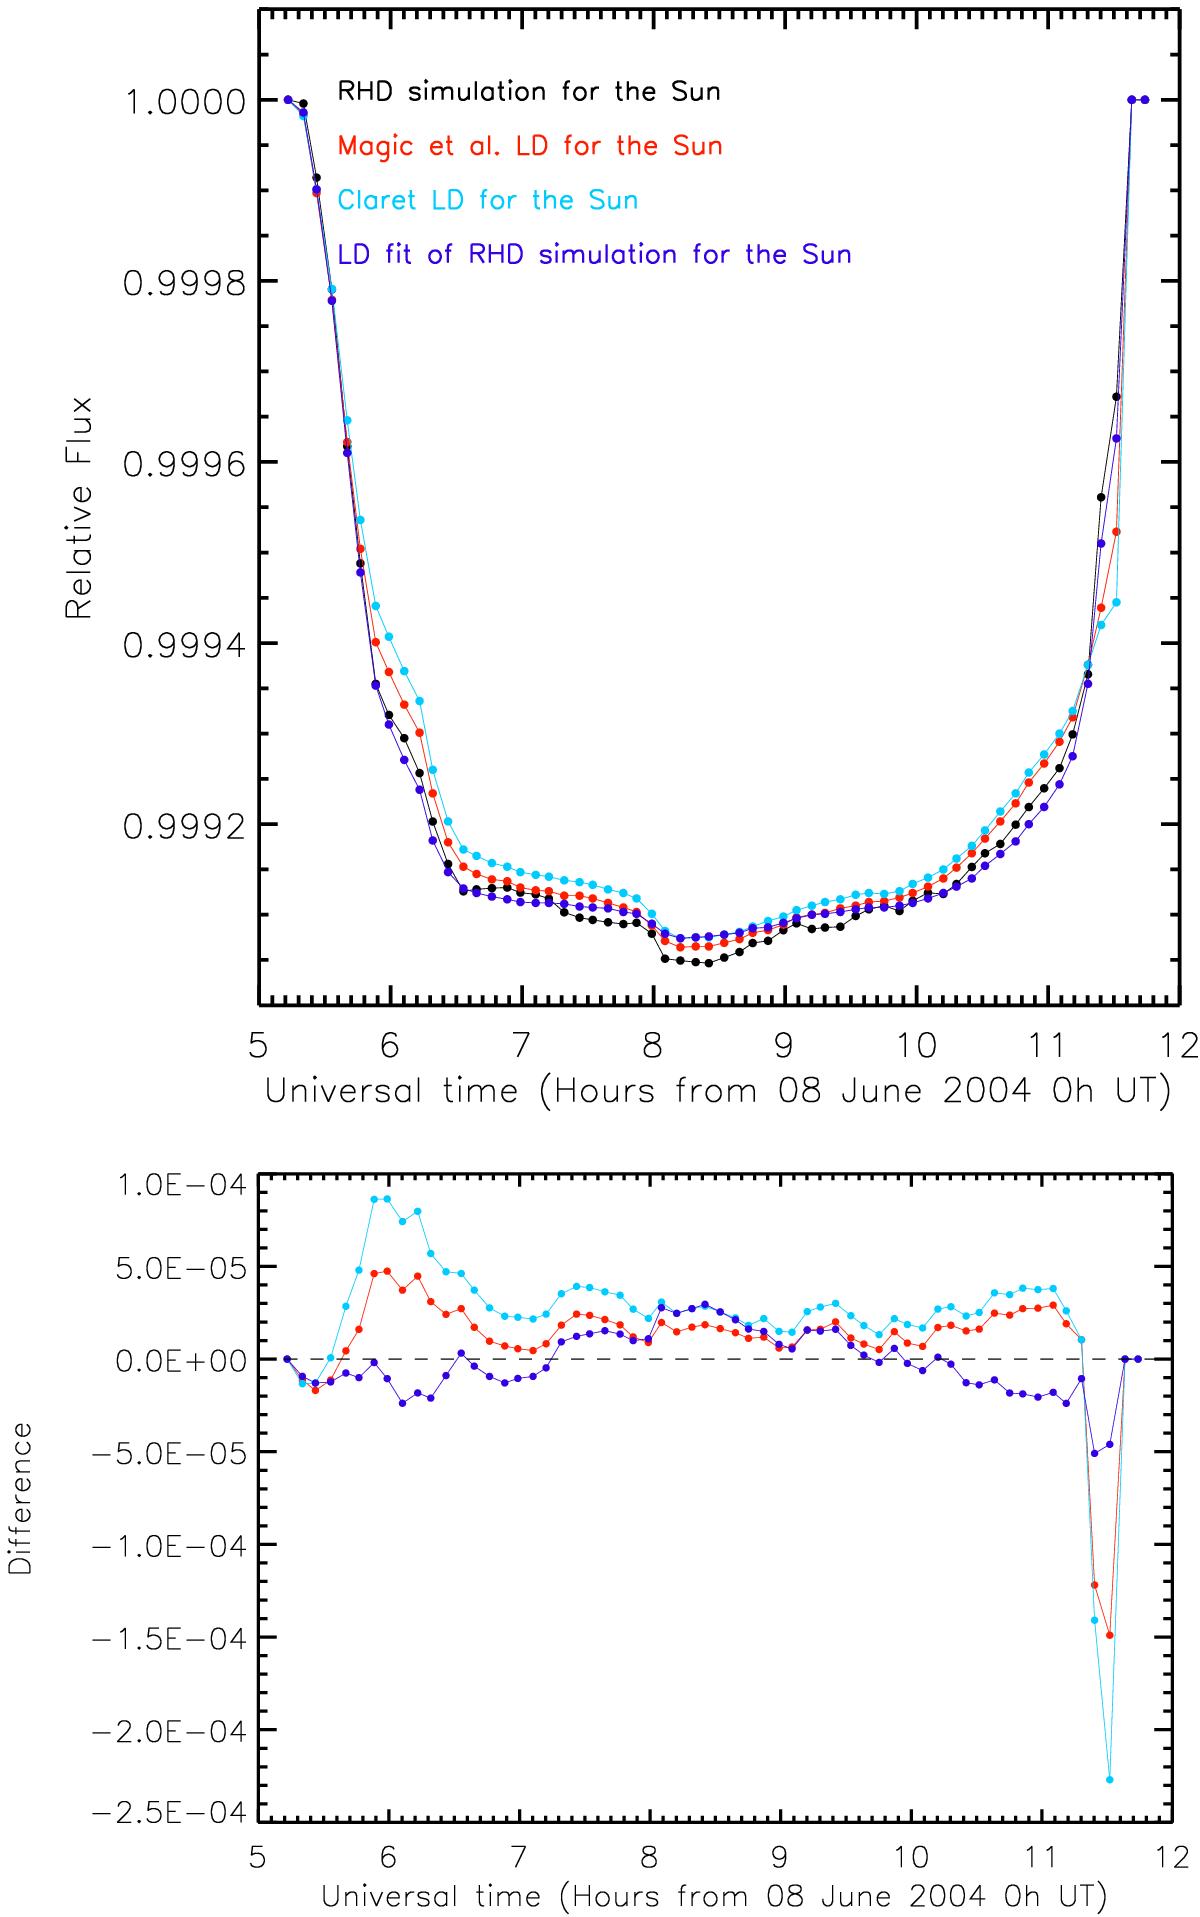
Top panel: comparison of different ToV light curves. The black curve is the light curve combining the RHD simulation of the Sun (Figs. 5 and 6). The red and light blue curves represent the limb-darkening Magic et al. (2015) and Claret (2000), respectively. In the end, the purple curve represents the limb-darkening carried out using Claret’s law for the RHD ⟨ 3D ⟩ profile of Fig. 2 (green curve). In all the cases, a constant value is used for Venus intensity. Bottom panel: difference between the above curves with respect to the transit curve of the RHD simulation of Fig. 6.
Current usage metrics show cumulative count of Article Views (full-text article views including HTML views, PDF and ePub downloads, according to the available data) and Abstracts Views on Vision4Press platform.
Data correspond to usage on the plateform after 2015. The current usage metrics is available 48-96 hours after online publication and is updated daily on week days.
Initial download of the metrics may take a while.