Fig. 7
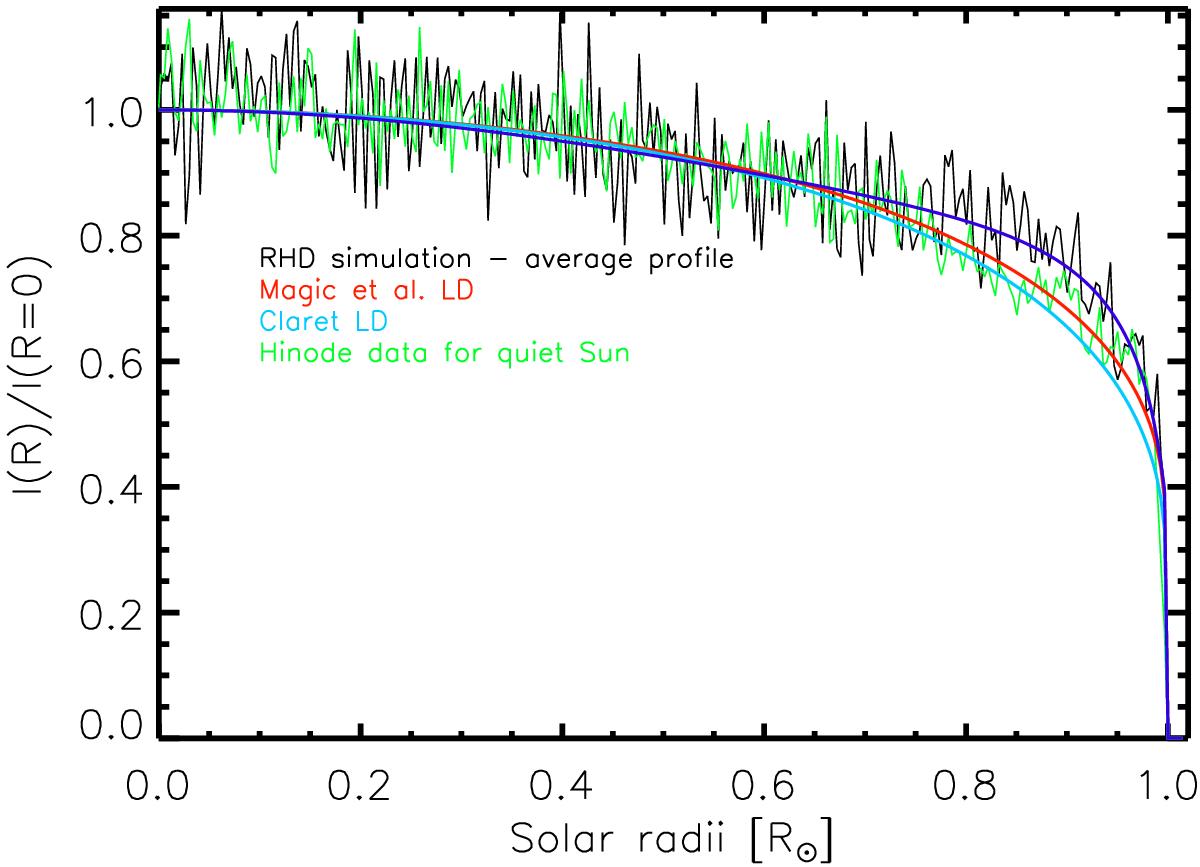
Cut at x = 0, y> 0 in different synthetic solar-disk images either built from Claret (2000; light blue curve), Magic et al. (2015; red curve), RHD ⟨3D⟩ profile (black curve, from Fig. 2) and Hinode data for the quiet Sun (green curve, used in Sect. 3.5). The intensity profiles are normalized to the intensity at the disk center (R = 0).
Current usage metrics show cumulative count of Article Views (full-text article views including HTML views, PDF and ePub downloads, according to the available data) and Abstracts Views on Vision4Press platform.
Data correspond to usage on the plateform after 2015. The current usage metrics is available 48-96 hours after online publication and is updated daily on week days.
Initial download of the metrics may take a while.