Fig. 3
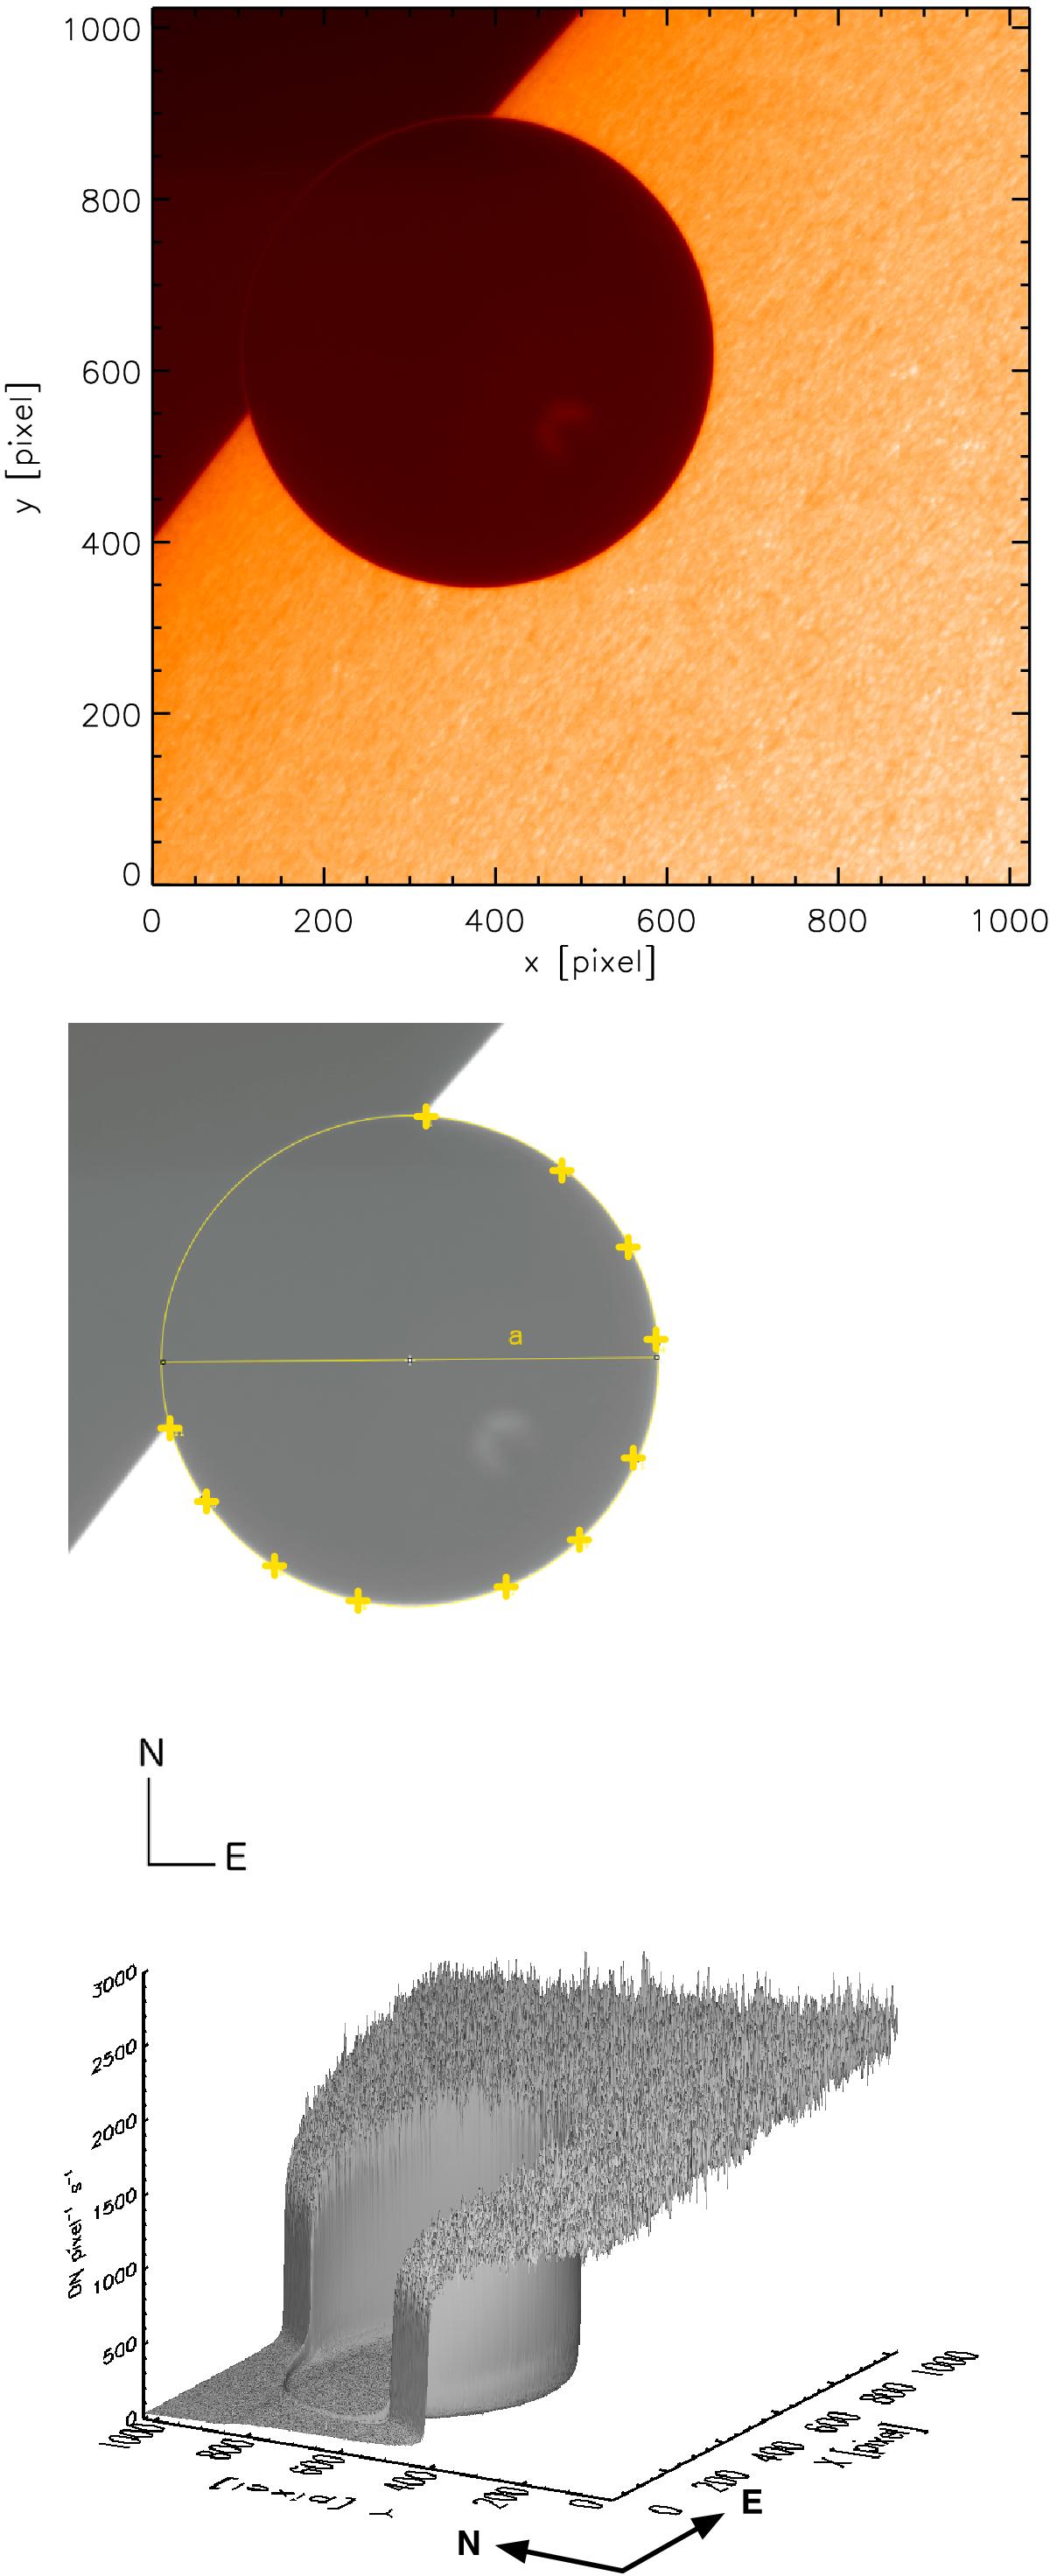
Top panel: image (1024 × 1024 pixels) of Venus (dark circular subaperture) transiting the Sun (brighter areas) on June 5, 2012 as seen by the Hinode SOT/SP spectropolarimeter (total intensity Stoke parameter I) in the red filter centered at 6684.0 ± 0.1Å (red filter). The intensity range is 0.–2.7 × 10³ DN pixel-1 s-1 (where DN is data number, Lites et al. 2013). The intensity plotted is the square root of the intensity to better display the “aureole”. Central panel: same figure as above with the contrast highly increased to fit the radius of the planet, yellow circle, with the procedure described in the text (Rfit = 274.91 pixels). The center of the Sun is located in southeast direction. Bottom panel: three-dimensional view of the images above. The contribution of the aureole is visible in the region just outside the solar disk.
Current usage metrics show cumulative count of Article Views (full-text article views including HTML views, PDF and ePub downloads, according to the available data) and Abstracts Views on Vision4Press platform.
Data correspond to usage on the plateform after 2015. The current usage metrics is available 48-96 hours after online publication and is updated daily on week days.
Initial download of the metrics may take a while.