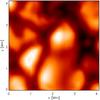
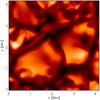
Fig. 10
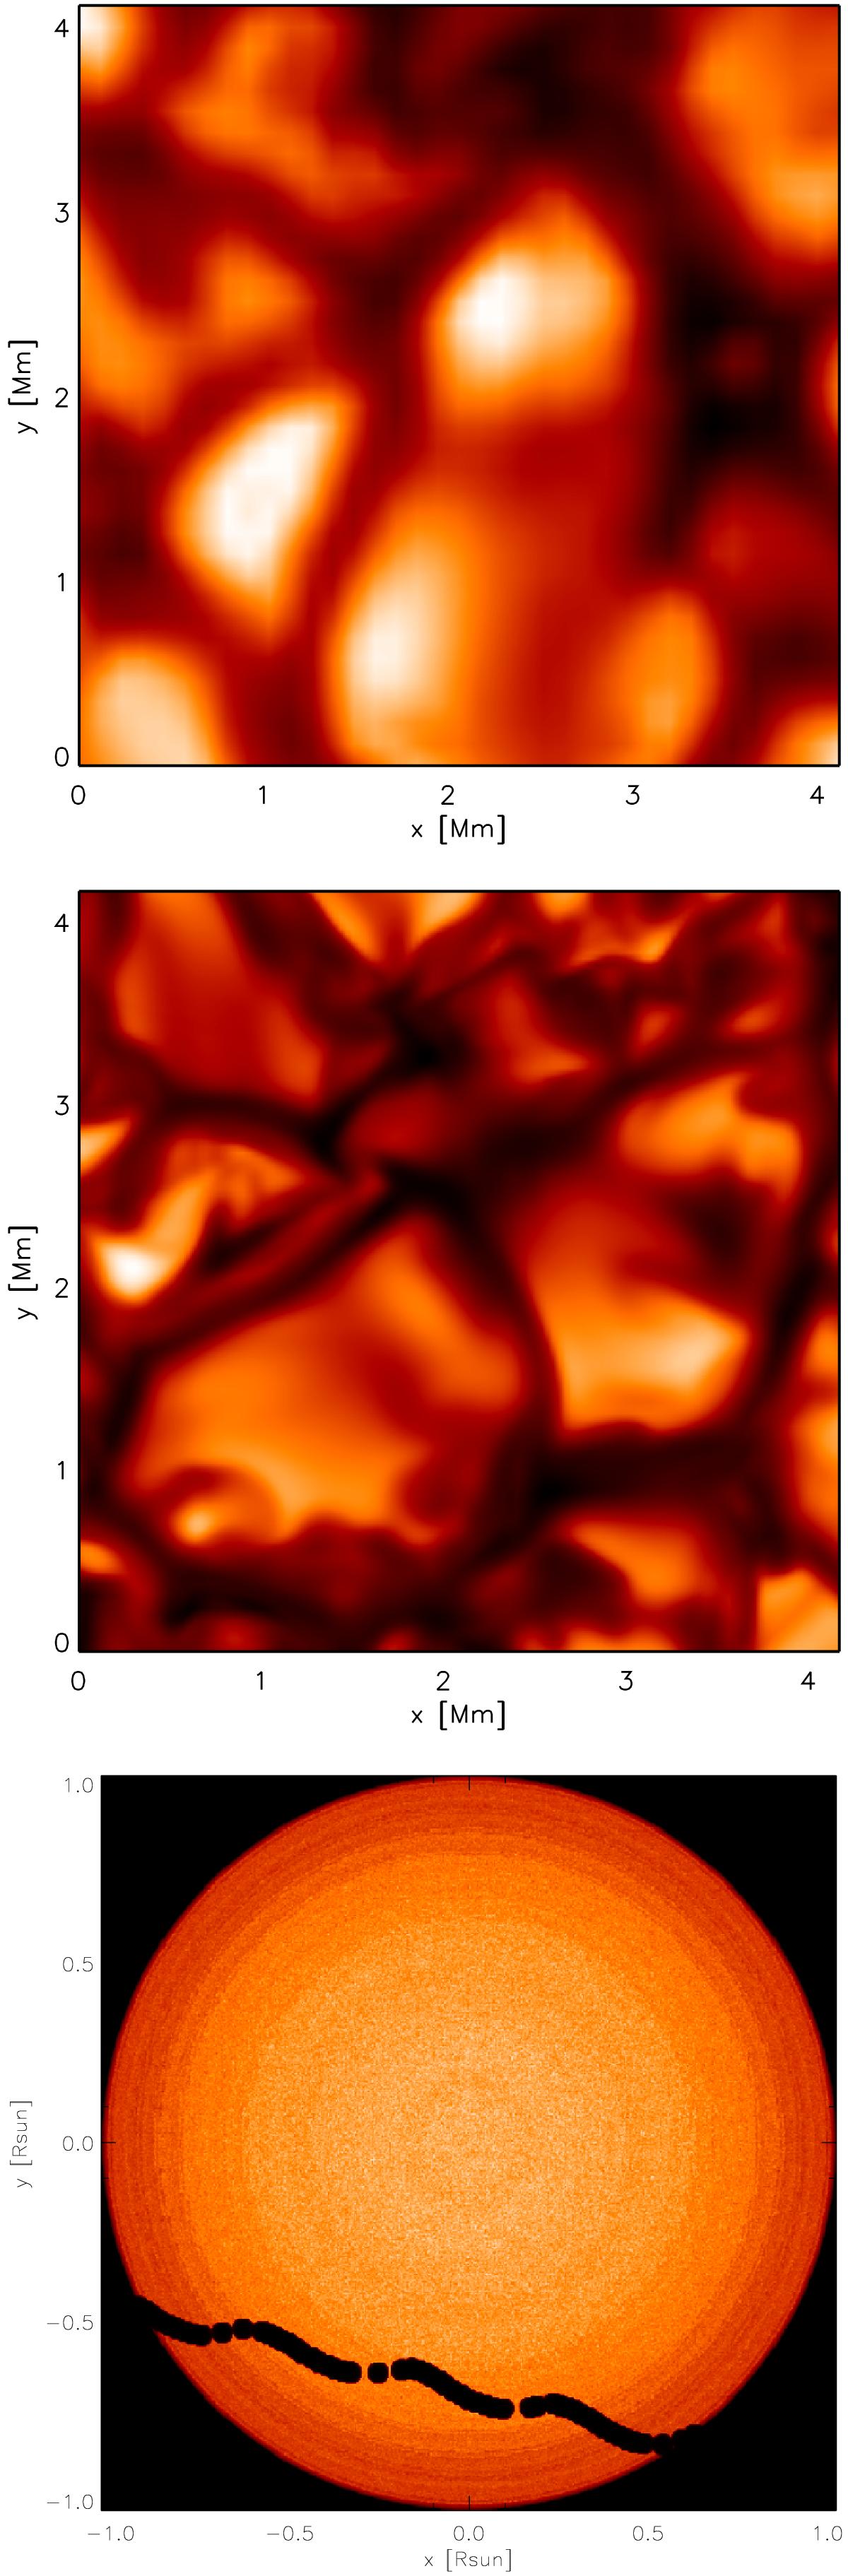
Top panel: cut of 37 × 37 pixels from the top panel of Fig. 9. Central panel: intensity map of a small portion of the solar surface at μ = 1 from the RHD of Table 1. The intensity range is [2.0–4.3 × 10⁶ erg cm-2 s-1 Å-1]. Bottom panel: ToV on the solar-disk image constructed with the tiling procedure of Sect. 2.3, but with real granulation observations (top panel and Fig. 9) of Hinode (see text for details). A constant value is used for the intensity of Venus.
Current usage metrics show cumulative count of Article Views (full-text article views including HTML views, PDF and ePub downloads, according to the available data) and Abstracts Views on Vision4Press platform.
Data correspond to usage on the plateform after 2015. The current usage metrics is available 48-96 hours after online publication and is updated daily on week days.
Initial download of the metrics may take a while.