Free Access
Fig. 1
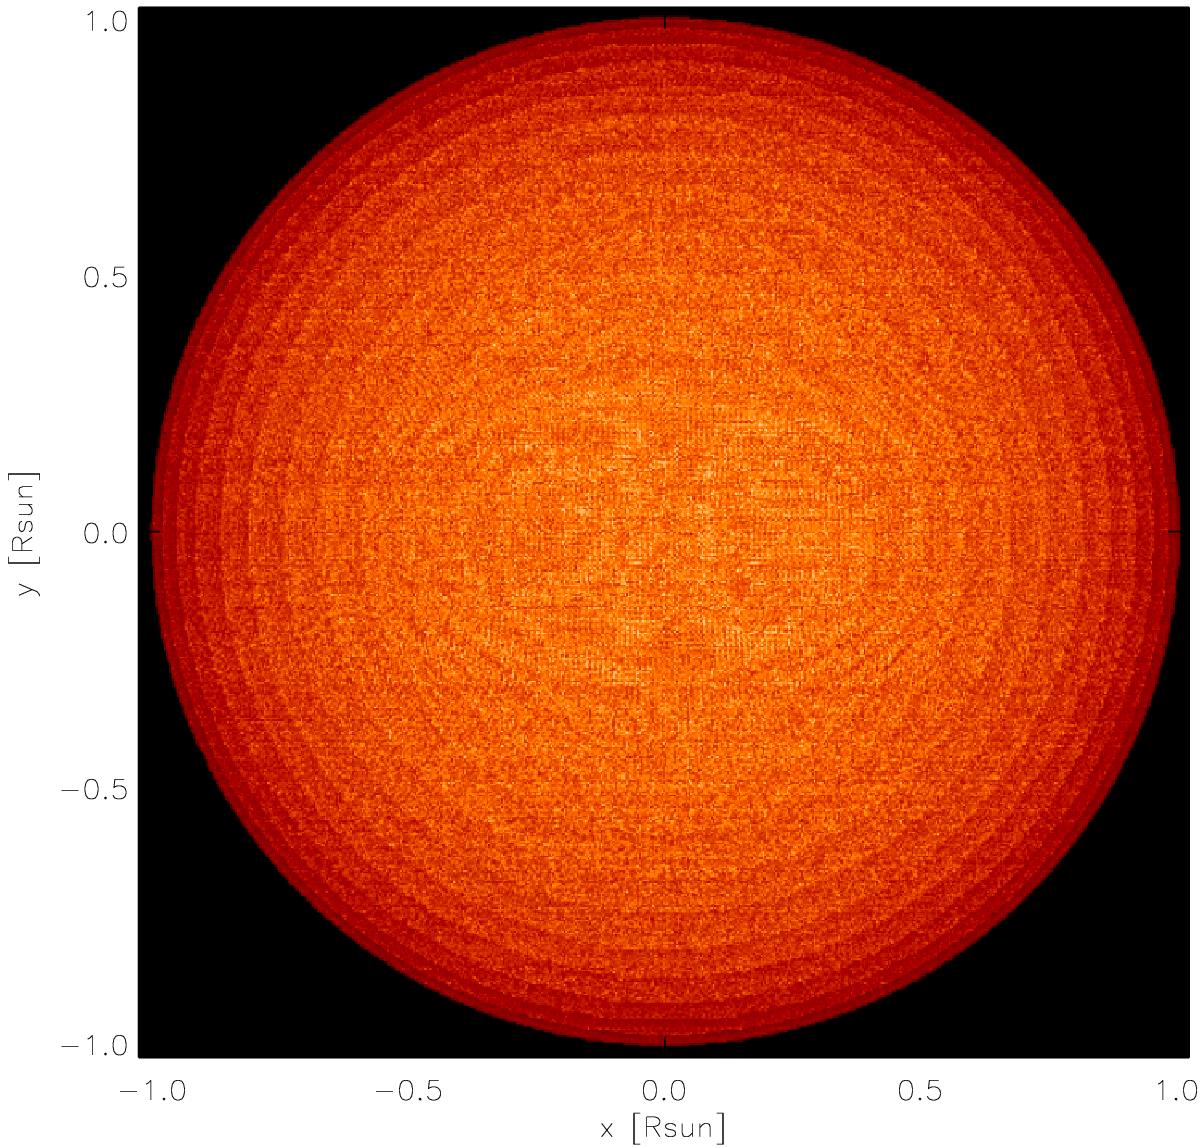
Synthetic solar-disk image computed at 6684.0 ± 0.1Å of the RHD simulation of Table 1. The intensity range is [0.0–3.79 × 10⁶ erg cm-2 s-1 Å-1]. We generated 50 different synthetic solar-disk images to account for granulation changes with respect to time.
Current usage metrics show cumulative count of Article Views (full-text article views including HTML views, PDF and ePub downloads, according to the available data) and Abstracts Views on Vision4Press platform.
Data correspond to usage on the plateform after 2015. The current usage metrics is available 48-96 hours after online publication and is updated daily on week days.
Initial download of the metrics may take a while.