Fig. 9
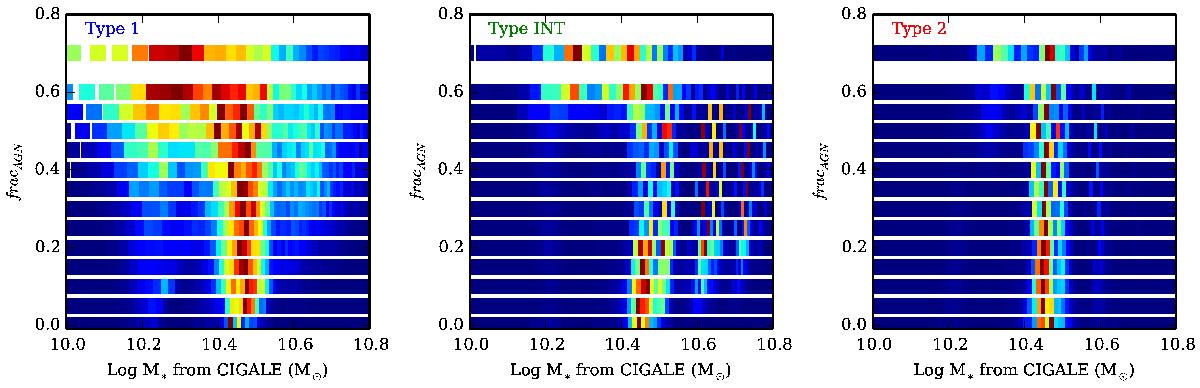
Probability distribution function for the M∗ determination of a particular galform SFH. The vertical axis in all panels corresponds to different input fracAGN. Each panel corresponds to a different AGN SED added to the stellar light: left is for the Type-1 AGN, the middle panel corresponds to the intermediate AGN type, and right panel plots the results for the Type-2 AGN. The colour indicates the level of probability, blue being the lowest probability, and red the highest. The true log M∗ for the particular simulated galaxy is 10.39 in solar units.
Current usage metrics show cumulative count of Article Views (full-text article views including HTML views, PDF and ePub downloads, according to the available data) and Abstracts Views on Vision4Press platform.
Data correspond to usage on the plateform after 2015. The current usage metrics is available 48-96 hours after online publication and is updated daily on week days.
Initial download of the metrics may take a while.