Free Access
Fig. 7
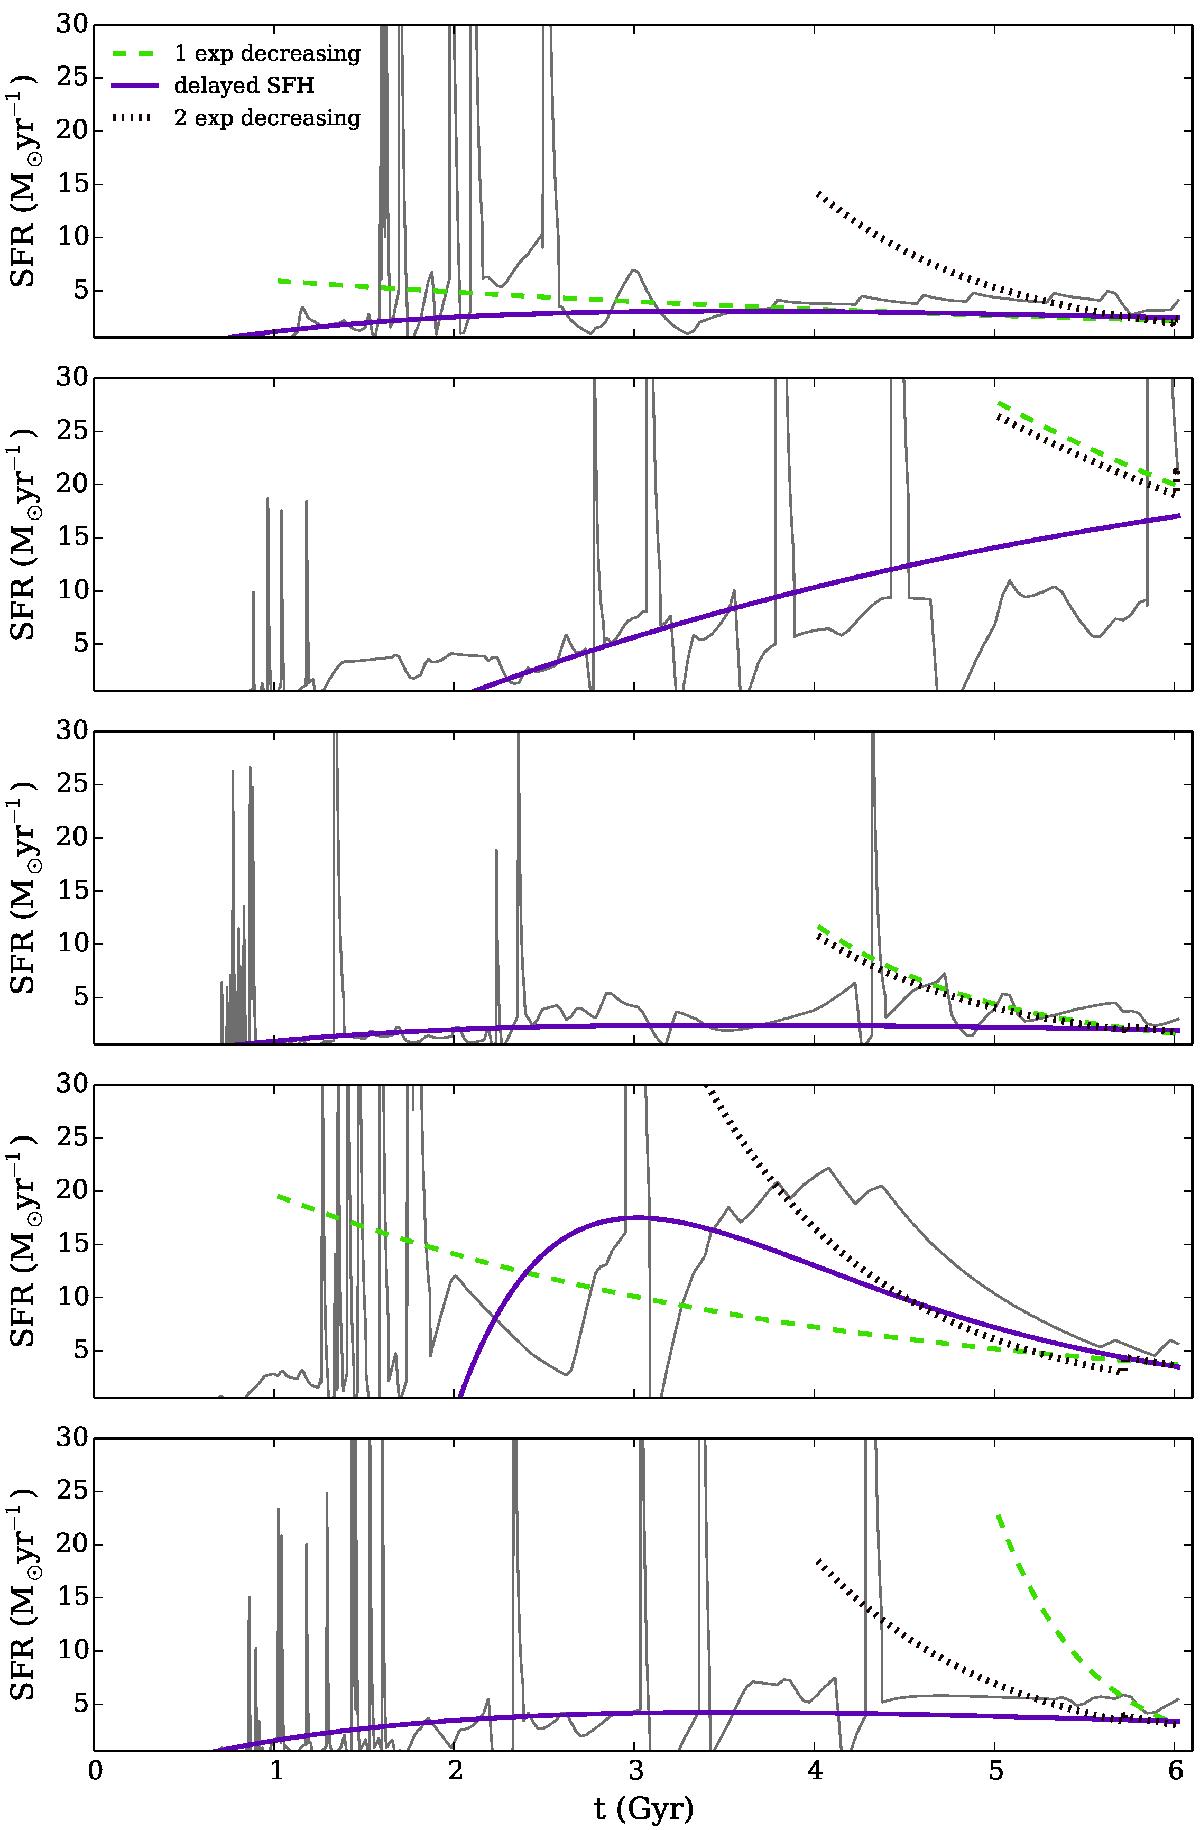
Comparison between five SFHs from galform and the corresponding best-fit output SFHs obtained by CIGALE. The green dashed line is for the 1τ-dec model, the purple solid line corresponds to the delayed SFH, and the black dotted line to the 2τ-dec model.
Current usage metrics show cumulative count of Article Views (full-text article views including HTML views, PDF and ePub downloads, according to the available data) and Abstracts Views on Vision4Press platform.
Data correspond to usage on the plateform after 2015. The current usage metrics is available 48-96 hours after online publication and is updated daily on week days.
Initial download of the metrics may take a while.