Fig. 6
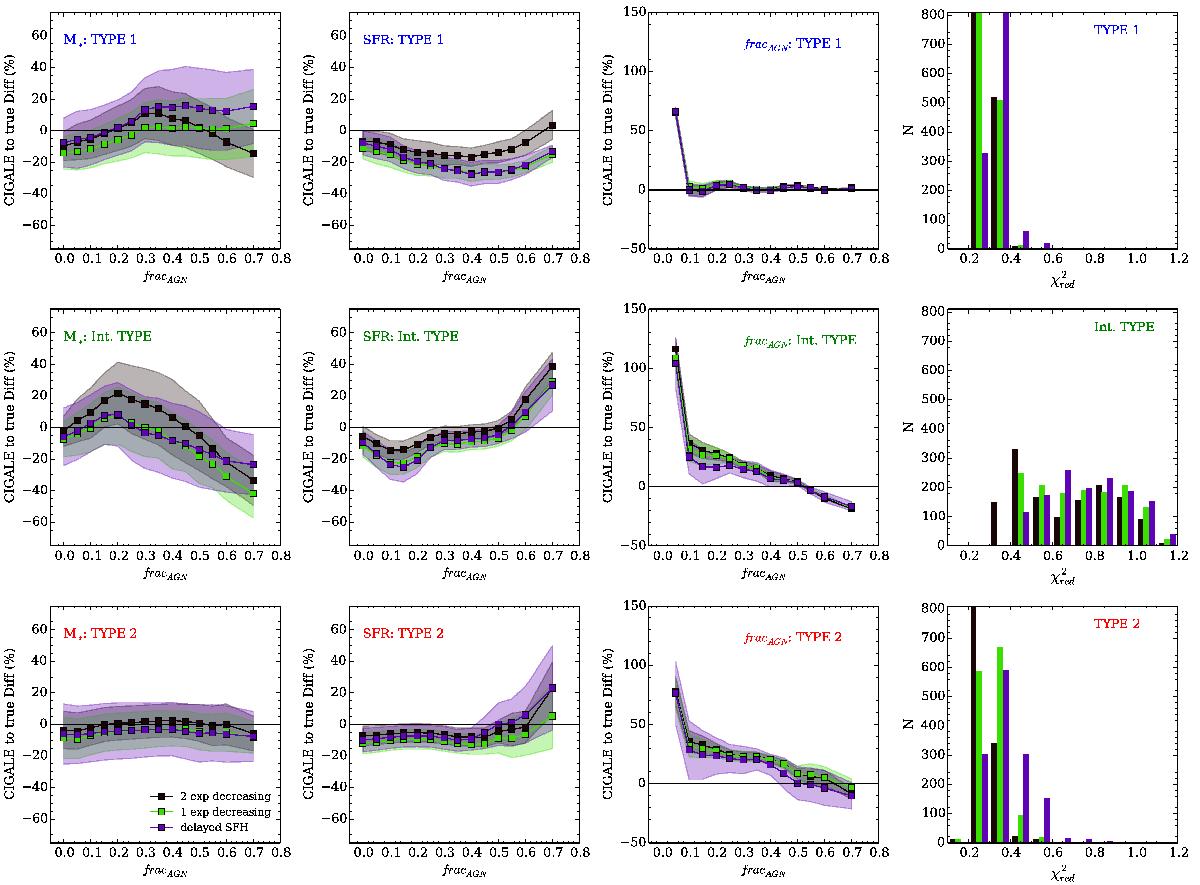
Fractional difference between parameters derived from CIGALE and the simulated ones as a function of fracAGN, i.e. the contribution of the AGN light to the overall IR luminosity. The first column of panels plots the fractional difference in stellar mass estimates. The second column is for SFR estimates and the third column corresponds to fracAGN. The fourth column of panels shows the distribution of ![]() . Each row corresponds to a set of simulations that assume different input SEDs for the AGN component. From top to bottom, we present results for Type-1 AGN, intermediate-type and Type-2 AGN. Different colours in each panel correspond to different functional forms for the SFH. Black is for the 2τ-dec model, green corresponds to the 1τ-dec model, and purple marks the delayed SFH. Dots represent the mean value of the fractional difference at each input fracAGN, and the shaded regions show the one σ scatter.
. Each row corresponds to a set of simulations that assume different input SEDs for the AGN component. From top to bottom, we present results for Type-1 AGN, intermediate-type and Type-2 AGN. Different colours in each panel correspond to different functional forms for the SFH. Black is for the 2τ-dec model, green corresponds to the 1τ-dec model, and purple marks the delayed SFH. Dots represent the mean value of the fractional difference at each input fracAGN, and the shaded regions show the one σ scatter.
Current usage metrics show cumulative count of Article Views (full-text article views including HTML views, PDF and ePub downloads, according to the available data) and Abstracts Views on Vision4Press platform.
Data correspond to usage on the plateform after 2015. The current usage metrics is available 48-96 hours after online publication and is updated daily on week days.
Initial download of the metrics may take a while.