Fig. 13
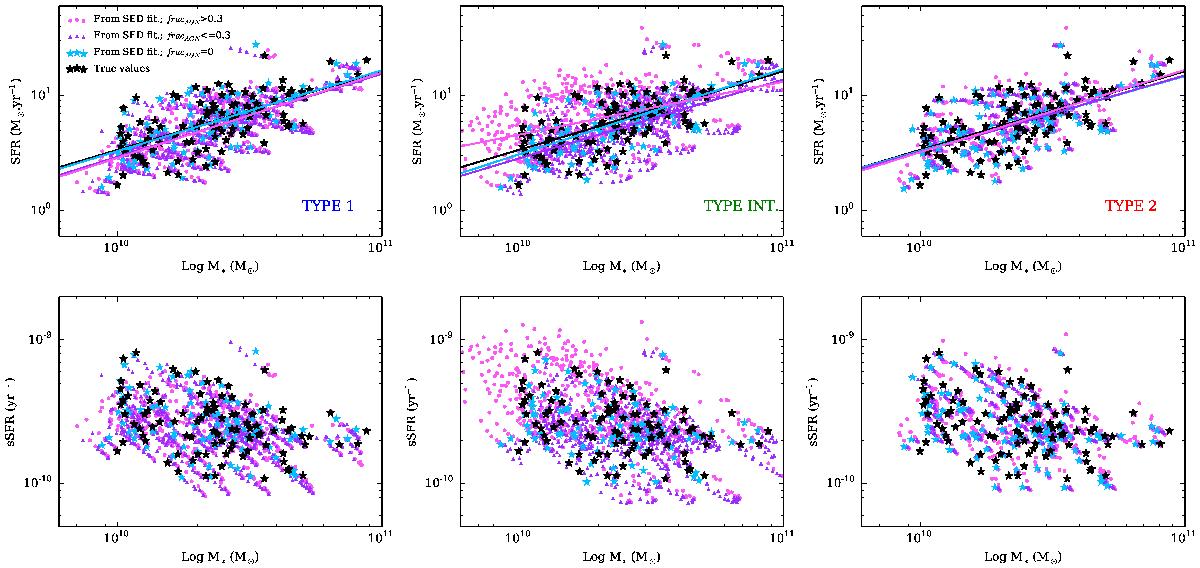
Top panels: SFR − M∗ diagram for the Type-1 sample (left), the intermediate-type (middle), and the Type-2 sample (right) obtained when using the 2τ-dec SFH model for the fitting. Black stars are the true values of the SFR and M∗ of the mock galaxies. Cyan stars are the galaxies without any AGN component (fracAGN = 0), purple triangle are galaxies with an AGN contribution lower than 30%, and pink circle galaxies with an AGN contribution higher than 30%. Colored-lines are the linear fit corresponding to each subsample. Bottom panels: sSFR − M∗ diagram for the Type-1 sample (left), the intermediate-type (middle), and the Type-2 sample (right).
Current usage metrics show cumulative count of Article Views (full-text article views including HTML views, PDF and ePub downloads, according to the available data) and Abstracts Views on Vision4Press platform.
Data correspond to usage on the plateform after 2015. The current usage metrics is available 48-96 hours after online publication and is updated daily on week days.
Initial download of the metrics may take a while.