Fig. 9
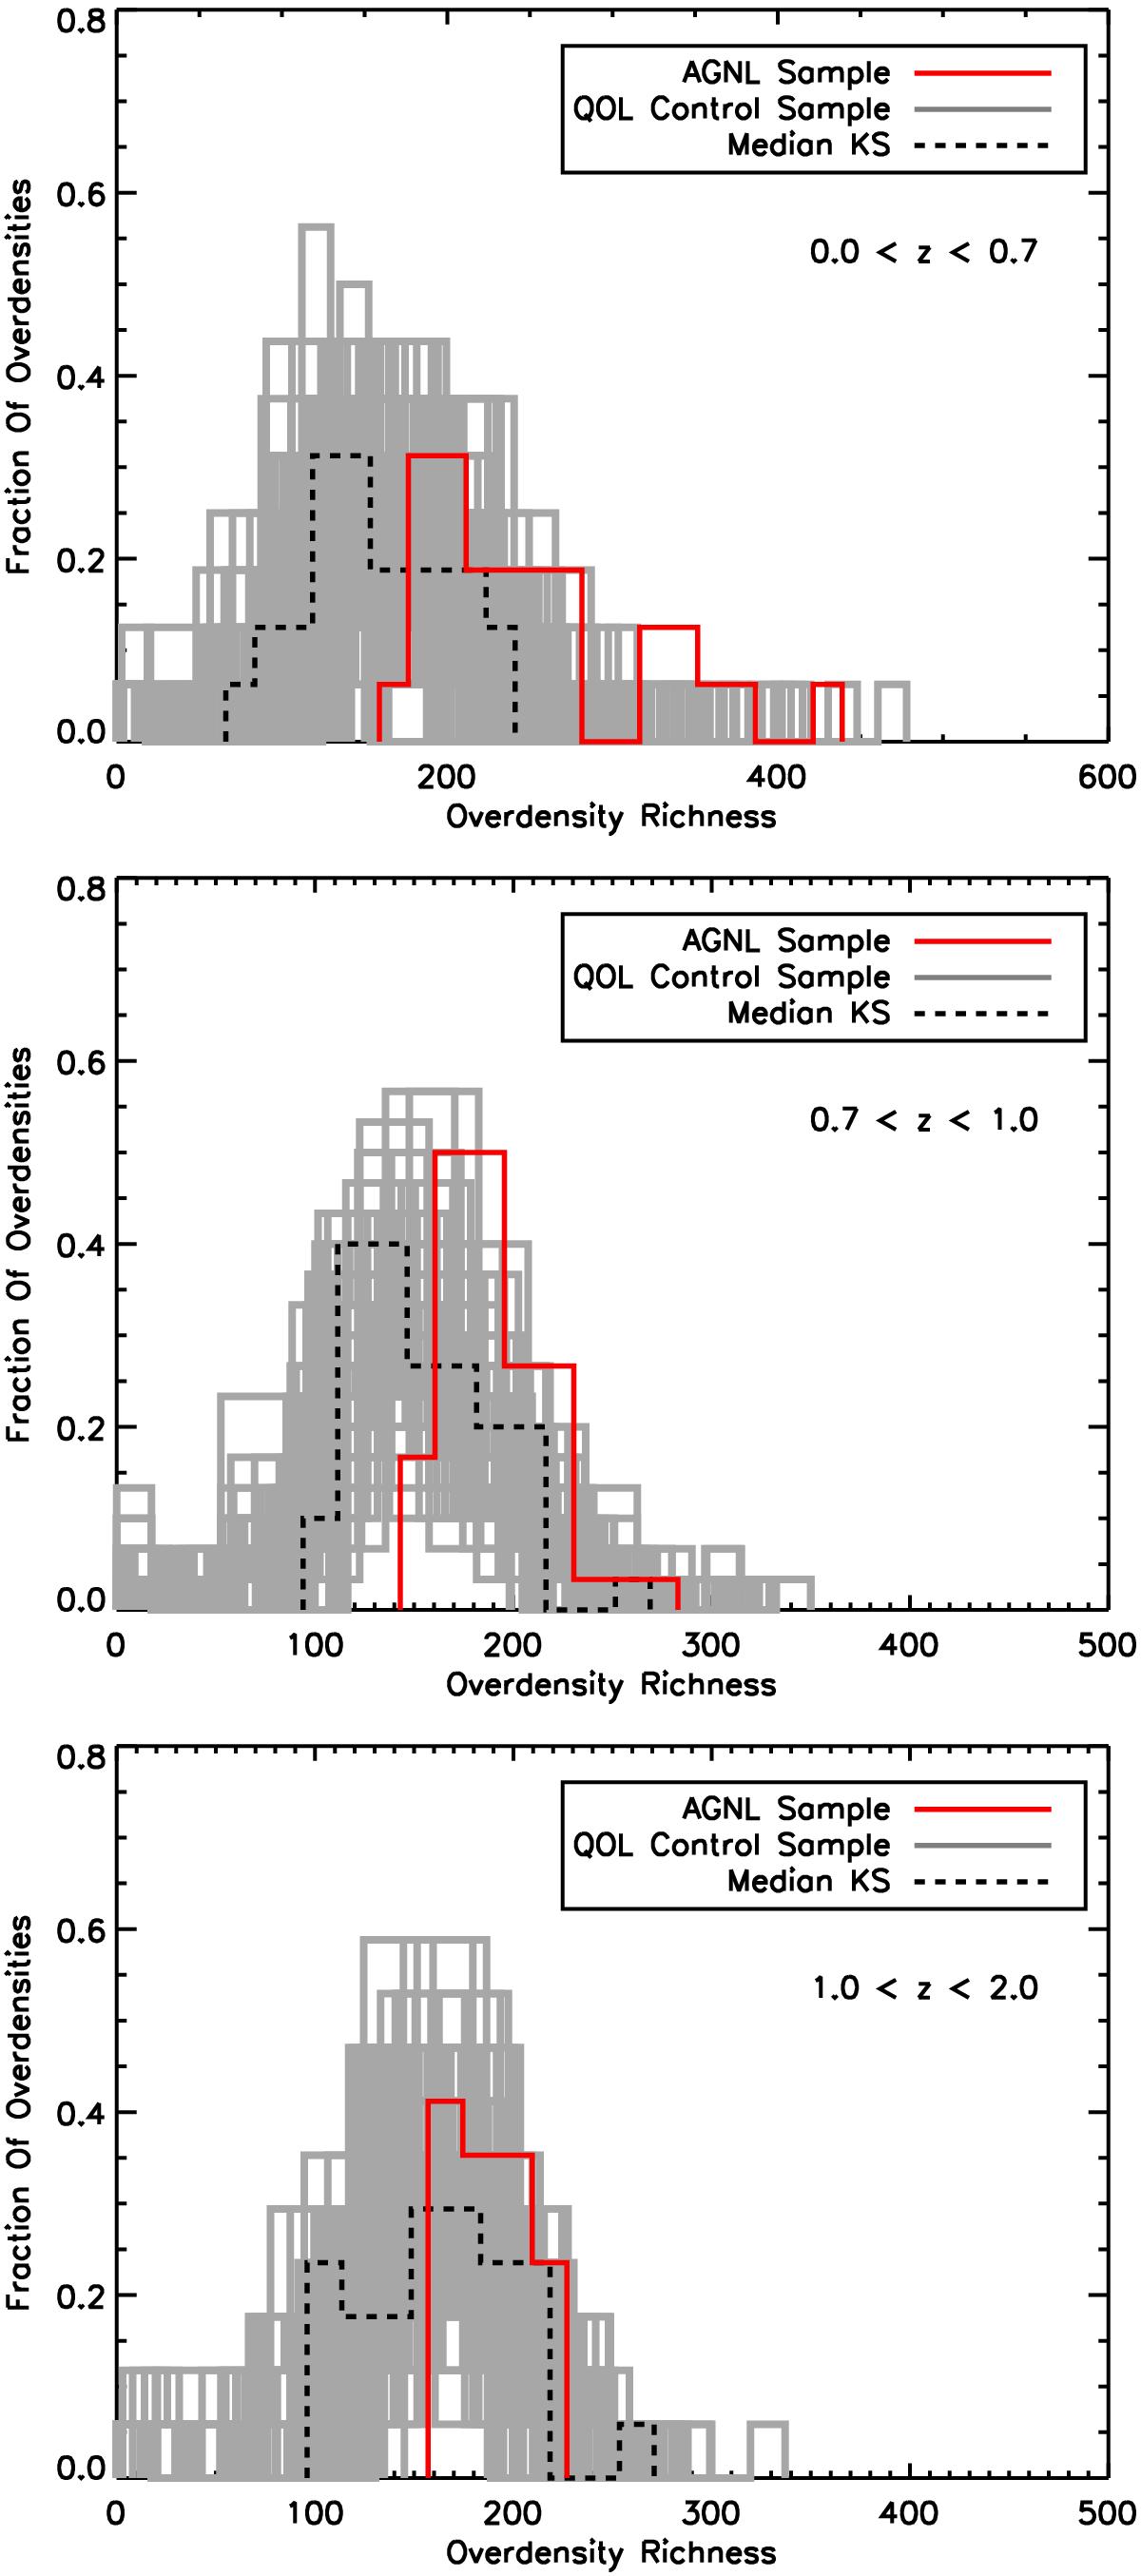
Galaxy overdensity richness distributions, samples AGNL and QOL. The top panel refers to 0 ≤ z< 0.7, the middle panel to 0.7 ≤ z< 1, and the bottom panel to 1 ≤ z ≤ 2. The solid red line refers to the AGNL sample, the grey lines correspond to the 100 extractions of the QOL Control sample. The dashed black line is the richness distribution of the Control sample extraction corresponding to the median value of the KS probability value distribution.
Current usage metrics show cumulative count of Article Views (full-text article views including HTML views, PDF and ePub downloads, according to the available data) and Abstracts Views on Vision4Press platform.
Data correspond to usage on the plateform after 2015. The current usage metrics is available 48-96 hours after online publication and is updated daily on week days.
Initial download of the metrics may take a while.