Fig. 4
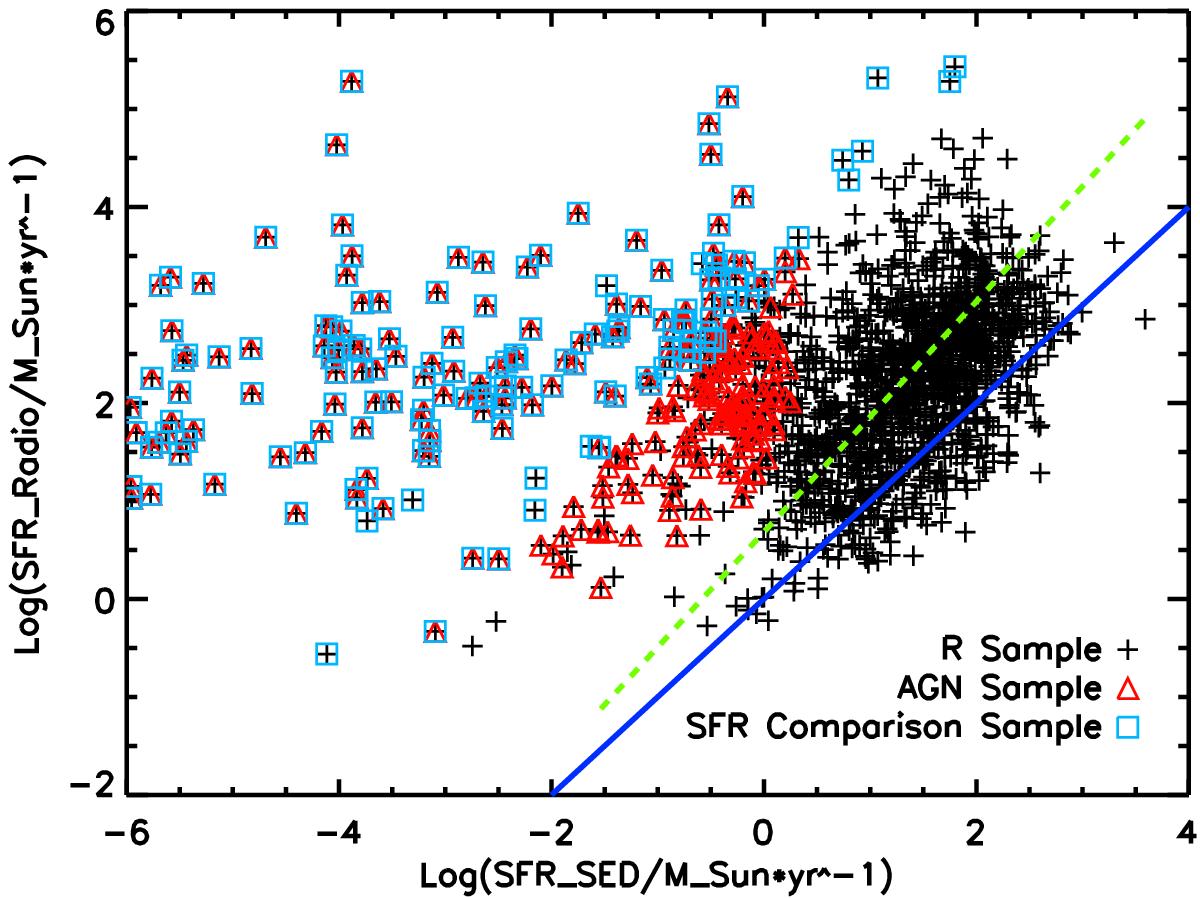
AGN sample definition. The black crosses represent the R sample, the red triangles represent the AGNs selected through the cut in SSFR, while the cyan squares represent the AGN sample defined through SFR comparison. The dashed green line represents the linear fit relation described in text, while the solid blue line shows the SFRRadio = SFRSED relation.
Current usage metrics show cumulative count of Article Views (full-text article views including HTML views, PDF and ePub downloads, according to the available data) and Abstracts Views on Vision4Press platform.
Data correspond to usage on the plateform after 2015. The current usage metrics is available 48-96 hours after online publication and is updated daily on week days.
Initial download of the metrics may take a while.