Fig. 11
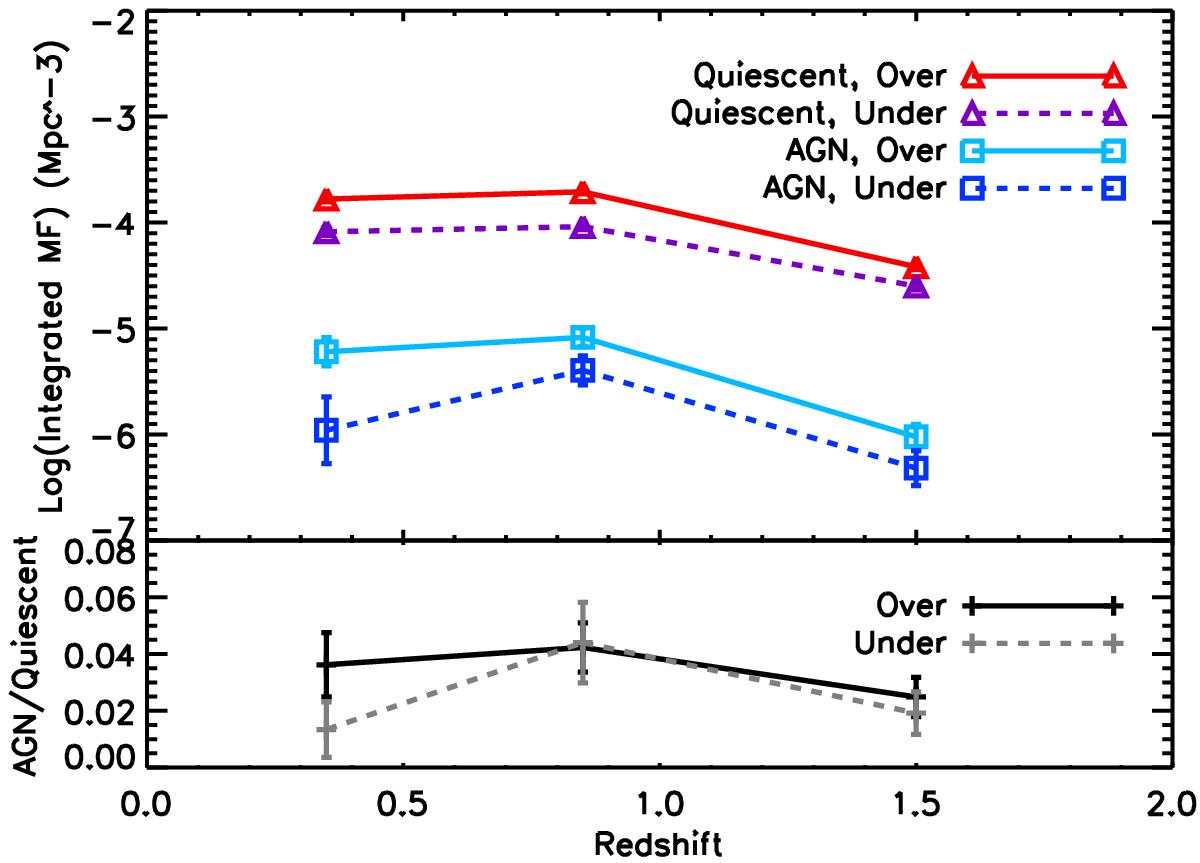
Environment effect on the integrated mass functions. All samples have been split in two, as stated by the legend, with the terms “Over”and “Under”referring to high-density environments (over the median value) and low-density ones (under the median value). Upper panel: red and purple triangles refer to quiescent UltraVISTA galaxies, cyan and blue squares to the AGN sample. Lower panel: black and grey curves represent the ratio of AGN hosting to quiescent galaxies. Solid lines are for high-density environments, dashed lines for the low-density ones. Points have been placed at values of redshift corresponding to the mean redshift of each redshift bin.
Current usage metrics show cumulative count of Article Views (full-text article views including HTML views, PDF and ePub downloads, according to the available data) and Abstracts Views on Vision4Press platform.
Data correspond to usage on the plateform after 2015. The current usage metrics is available 48-96 hours after online publication and is updated daily on week days.
Initial download of the metrics may take a while.