Fig. 10
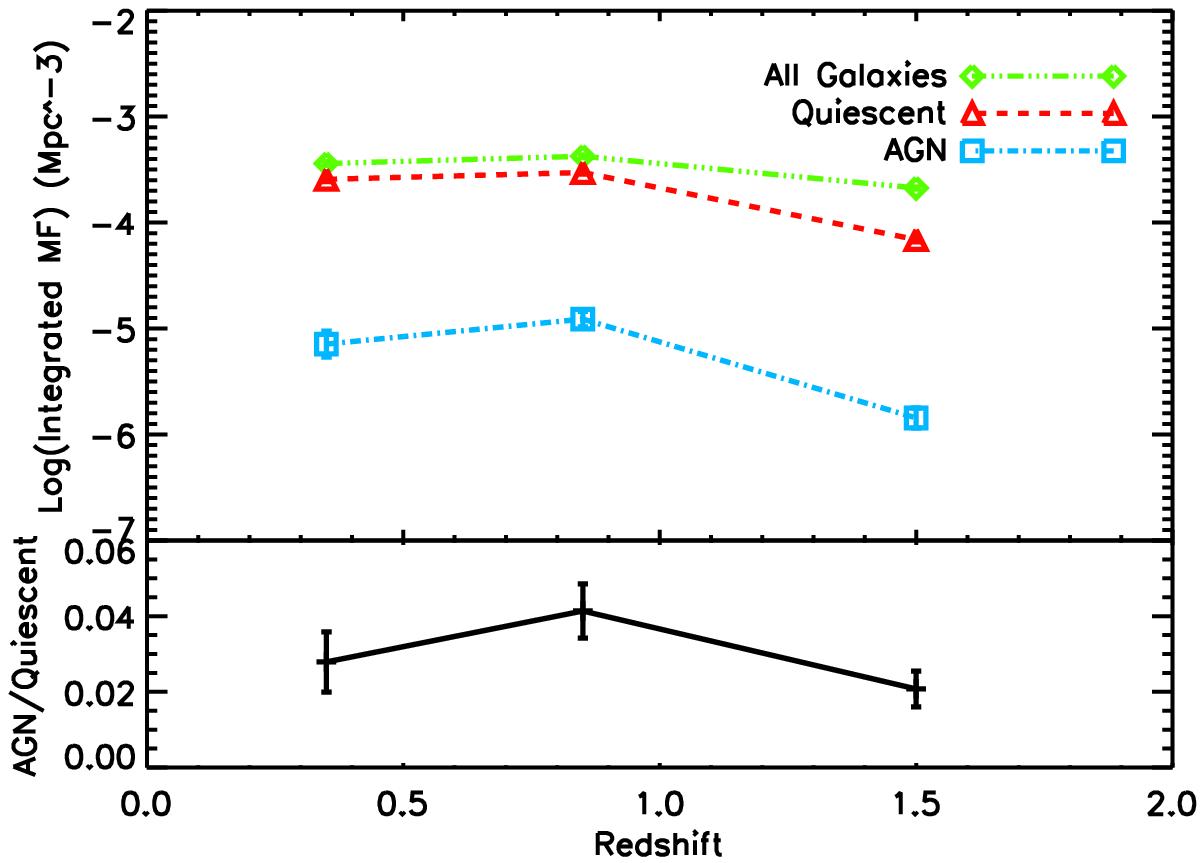
Redshift evolution of the integrated mass functions. Upper panel: value of the integrated mass functions. The curves refer to all UltraVISTA galaxies (green diamonds) and to a selection of only the quiescent ones (red triangles) and the radio AGN sample (cyan squares). Lower panel: ratio of the integrated mass function values for AGN hosting and quiescent galaxies. Points have been placed at values of redshift corresponding to the mean redshift of each redshift bin.
Current usage metrics show cumulative count of Article Views (full-text article views including HTML views, PDF and ePub downloads, according to the available data) and Abstracts Views on Vision4Press platform.
Data correspond to usage on the plateform after 2015. The current usage metrics is available 48-96 hours after online publication and is updated daily on week days.
Initial download of the metrics may take a while.