Fig. 2
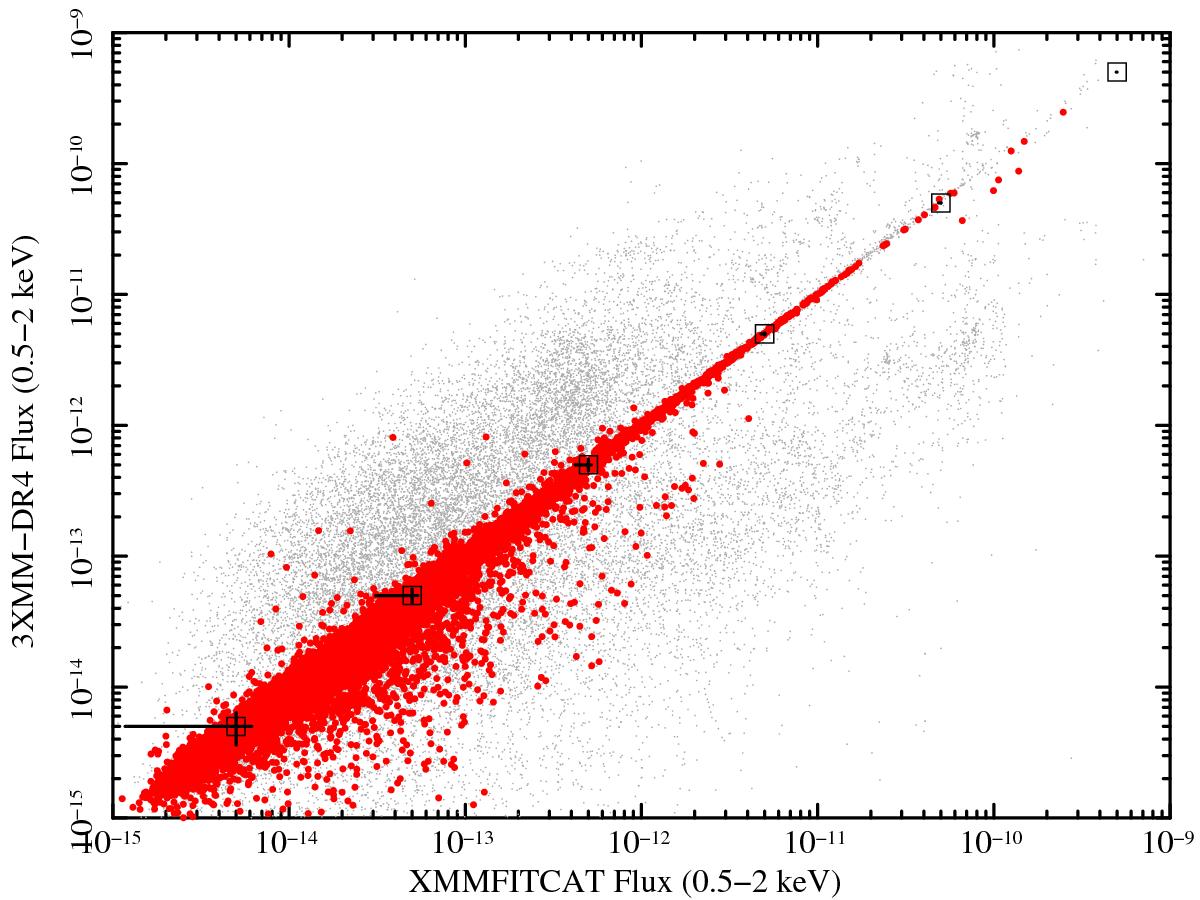
Observed fluxes in the Soft band (in erg cm-2 s-1) from the automated fits against the ones reported in the 3XMM-DR4 catalogue. Filled circles correspond to consistent fluxes between both catalogues, whereas small points correspond to non-consistent ones. Square points with error bars represent average error sizes at each flux interval.
Current usage metrics show cumulative count of Article Views (full-text article views including HTML views, PDF and ePub downloads, according to the available data) and Abstracts Views on Vision4Press platform.
Data correspond to usage on the plateform after 2015. The current usage metrics is available 48-96 hours after online publication and is updated daily on week days.
Initial download of the metrics may take a while.