Fig. 8
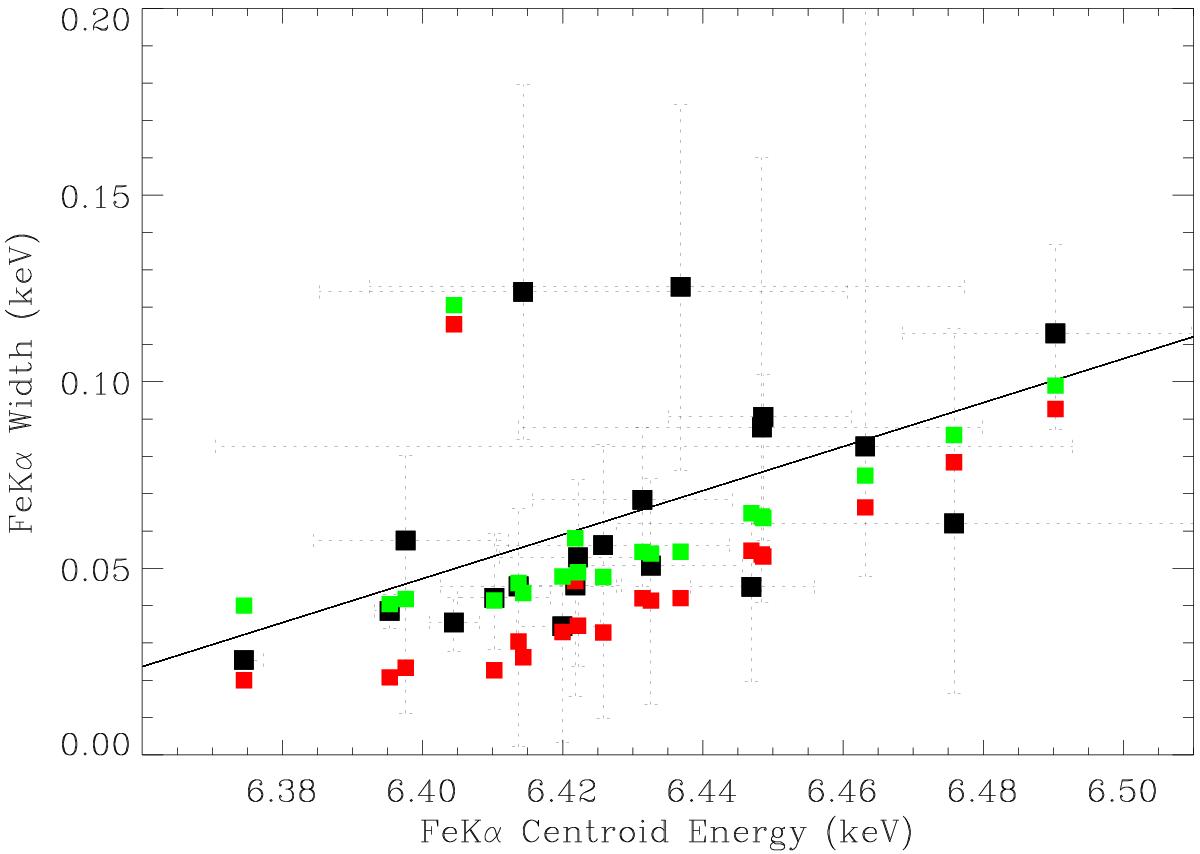
Width of FeKα (σline) versus the centroid energy (black squares). The black solid line traces a linear fit. We have marked in colour the expected width from the contribution of three different broadening phenomena: line blending, Compton broadening, and Doppler shifts, considering velocities of V(km s-1) = 1000 (red) and V(km s-1) = 2000 (green). Every single black square has an associated single red square and a single green square corresponding to the expected values of σline for that observation (see Sect. 4).
Current usage metrics show cumulative count of Article Views (full-text article views including HTML views, PDF and ePub downloads, according to the available data) and Abstracts Views on Vision4Press platform.
Data correspond to usage on the plateform after 2015. The current usage metrics is available 48-96 hours after online publication and is updated daily on week days.
Initial download of the metrics may take a while.