Free Access
Fig. 6
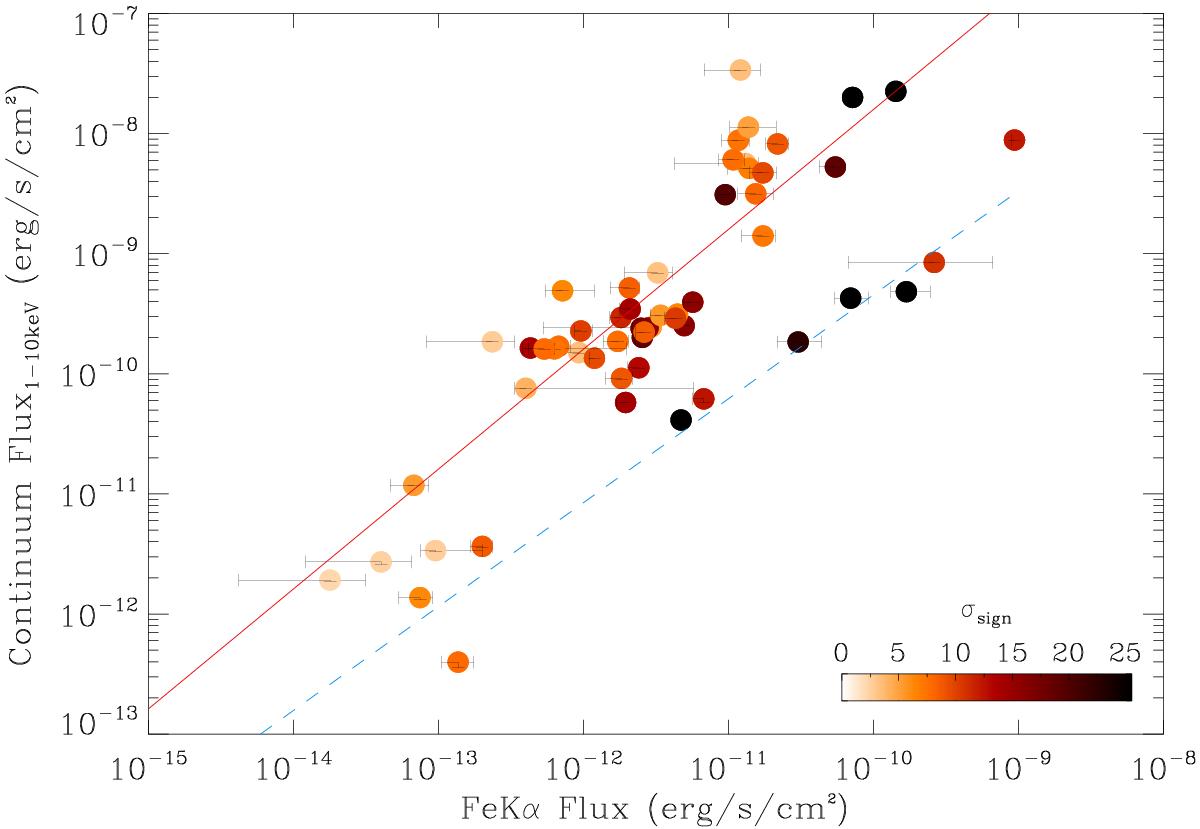
F1−10 keV versus FFeKα. Blue dashed line marks the correlation observed for IGR J16318-4848 jointly with eclipse observations, and the red solid line follows the bulk of the observations. The colour map indicates the σsign of the line (defined in Sect. 2.2).
Current usage metrics show cumulative count of Article Views (full-text article views including HTML views, PDF and ePub downloads, according to the available data) and Abstracts Views on Vision4Press platform.
Data correspond to usage on the plateform after 2015. The current usage metrics is available 48-96 hours after online publication and is updated daily on week days.
Initial download of the metrics may take a while.