Fig. 4
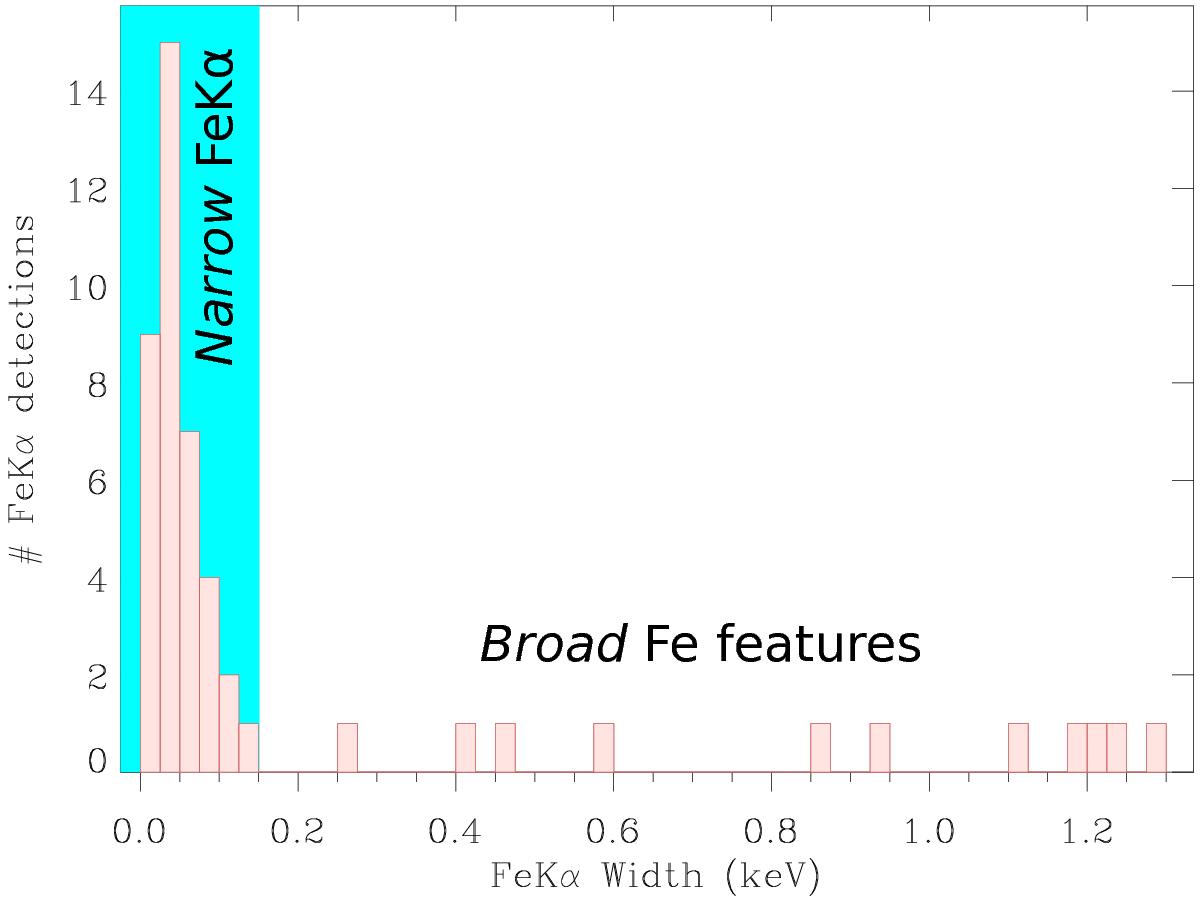
Histogram of the FeKα width. The bulk of the detections are grouped showing σline< 0.15 keV. We define them as narrow FeKα. The rest are defined as broad Fe features. Even though we have detected 60 narrow FeKα, this plot only includes 38. The reason is that 22 of them are very narrow (or the signal-to-noise very low) and they have been treated in the fits as delta functions. (In Table A.3 we present their width as σline = 0.)
Current usage metrics show cumulative count of Article Views (full-text article views including HTML views, PDF and ePub downloads, according to the available data) and Abstracts Views on Vision4Press platform.
Data correspond to usage on the plateform after 2015. The current usage metrics is available 48-96 hours after online publication and is updated daily on week days.
Initial download of the metrics may take a while.