Fig. 8
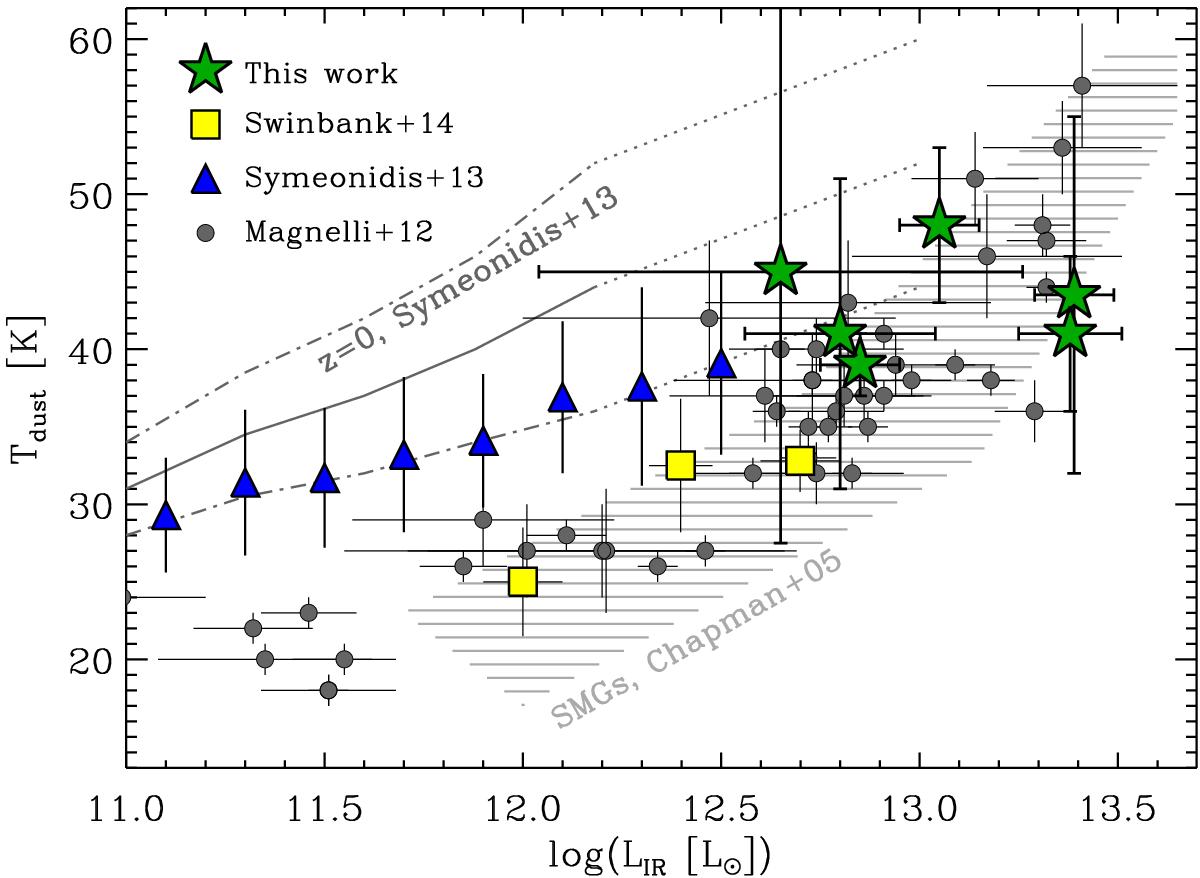
Dust temperature plotted as a function of IR luminosity. The values obtained for our SMGs are shown with green star symbols. The other symbols and lines mark values and correlations from the quoted reference studies (see text for details). The shaded region illustrates the correlation found by Chapman et al. (2005) for their sample of SMGs.
Current usage metrics show cumulative count of Article Views (full-text article views including HTML views, PDF and ePub downloads, according to the available data) and Abstracts Views on Vision4Press platform.
Data correspond to usage on the plateform after 2015. The current usage metrics is available 48-96 hours after online publication and is updated daily on week days.
Initial download of the metrics may take a while.