Free Access
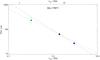
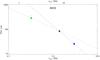
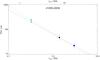
Fig. 6
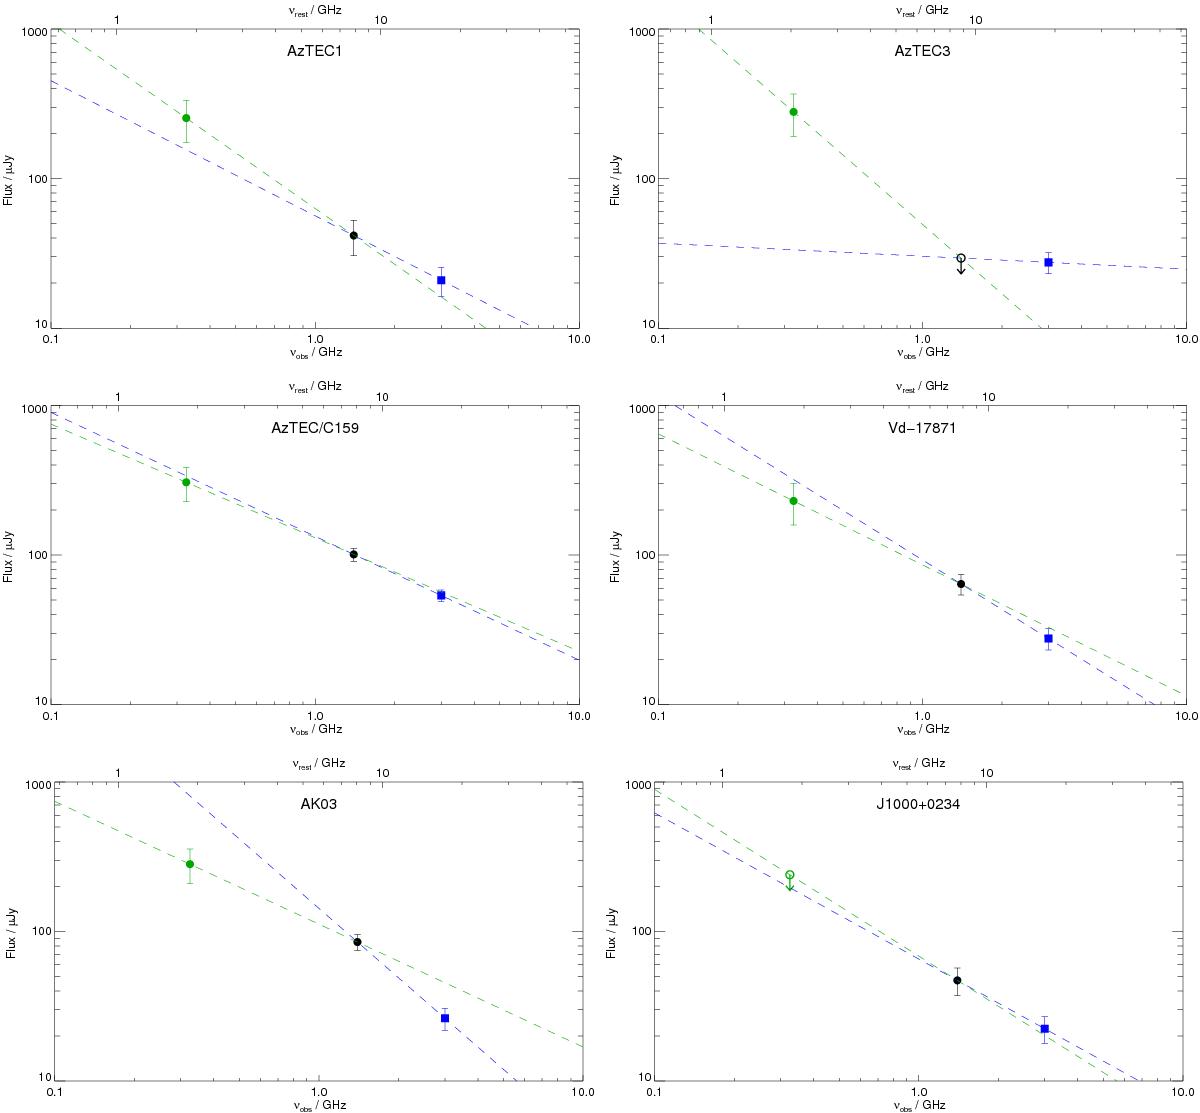
Radio SEDs of the studied SMGs. The dashed lines in each panel represent the spectral slope taking 325 MHz (green point and error-bar) and 1.4 GHz (black point and error-bar; green dashed line) and 1.4 GHz and 3 GHz (blue point and error-bar) data-points (blue dashed line) into account.
This figure is made of several images, please see below:
Current usage metrics show cumulative count of Article Views (full-text article views including HTML views, PDF and ePub downloads, according to the available data) and Abstracts Views on Vision4Press platform.
Data correspond to usage on the plateform after 2015. The current usage metrics is available 48-96 hours after online publication and is updated daily on week days.
Initial download of the metrics may take a while.