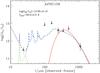
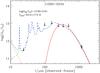
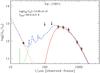
Fig. 5
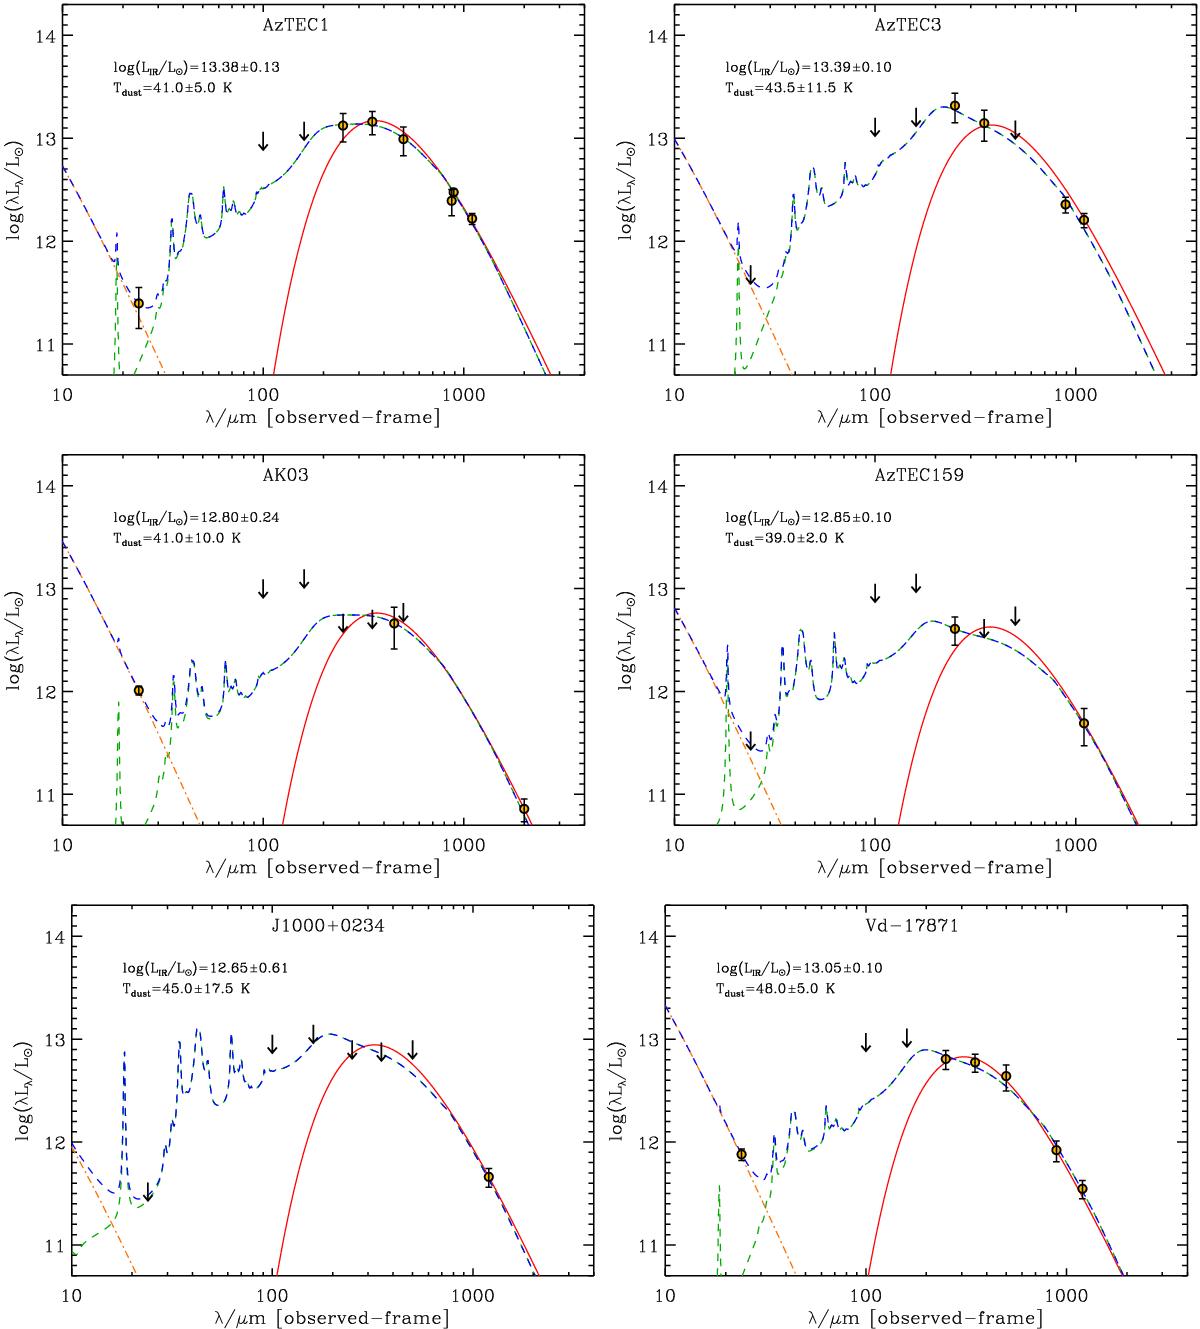
Broadband SEDs of the studied SMGs. The downward pointing arrows denote upper limits to the corresponding flux densities. The red line represents a modified blackbody fit to the FIR-to-mm data points. The blue dashed line is the best fit model, obtained from the superposition of the best fit Draine & Li (2007) model (long-dashed green line) and the stellar black body function (orange dash-dotted line) assuming a temperature of 5000 K, scaled to the residual 24 μm “stellar” flux (i.e., observed 24 μm flux minus that obtained from the DL07 best-fit model).
Current usage metrics show cumulative count of Article Views (full-text article views including HTML views, PDF and ePub downloads, according to the available data) and Abstracts Views on Vision4Press platform.
Data correspond to usage on the plateform after 2015. The current usage metrics is available 48-96 hours after online publication and is updated daily on week days.
Initial download of the metrics may take a while.