Fig. 3
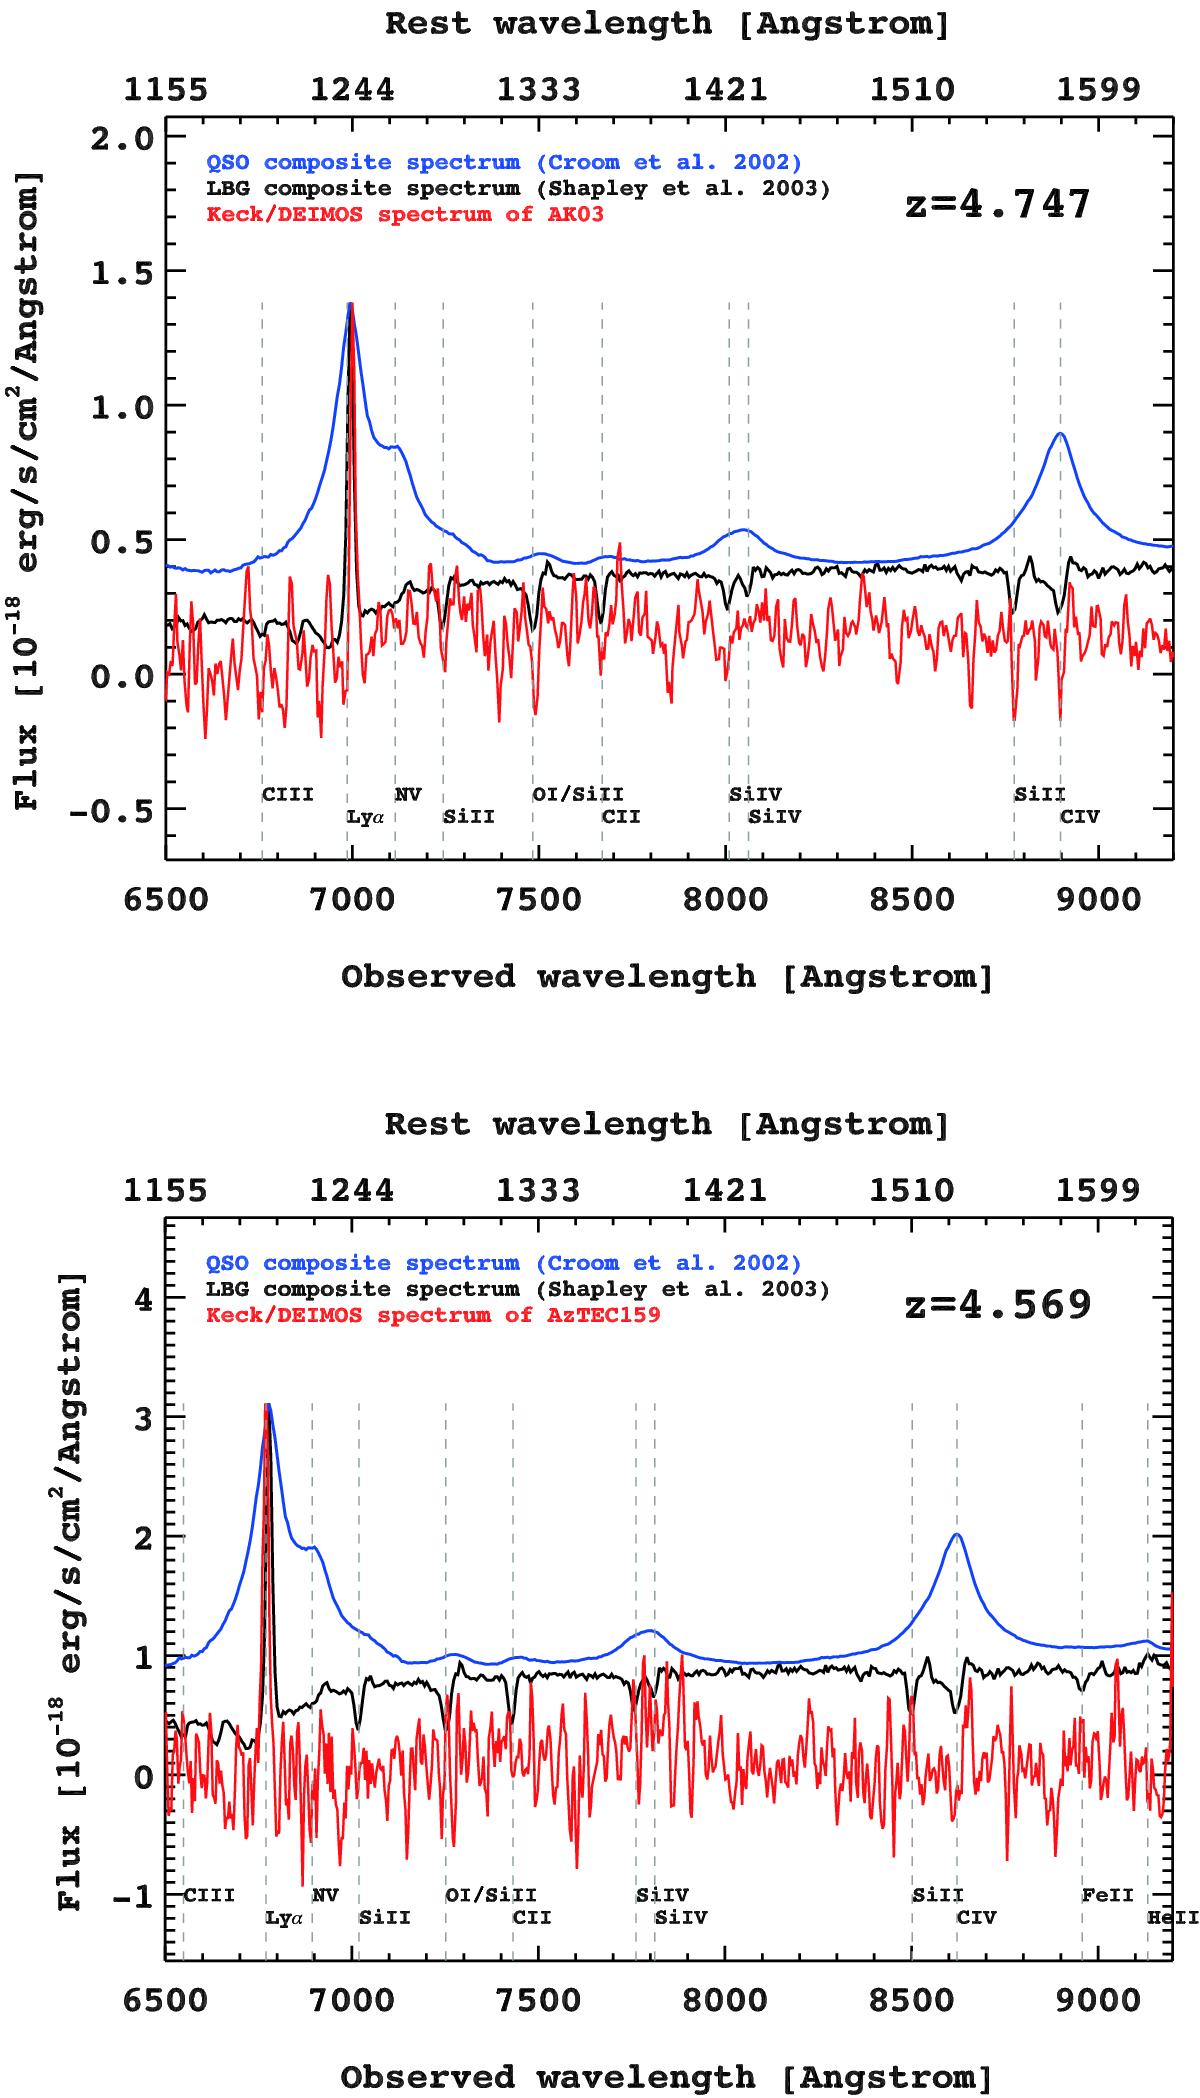
1D Keck II/DEIMOS spectra (red) for AK03 (top panel), and AzTEC/C159 (bottom panel). Also shown are QSO (blue) and LBG (black) composite spectra at the given redshift (labels in the panels). The vertical dashed lines indicate positions of various spectral lines, indicated in the panel. The spectroscopic redshift of the SMG is indicated in the top right corner of each panel.
Current usage metrics show cumulative count of Article Views (full-text article views including HTML views, PDF and ePub downloads, according to the available data) and Abstracts Views on Vision4Press platform.
Data correspond to usage on the plateform after 2015. The current usage metrics is available 48-96 hours after online publication and is updated daily on week days.
Initial download of the metrics may take a while.