Free Access
Fig. 21
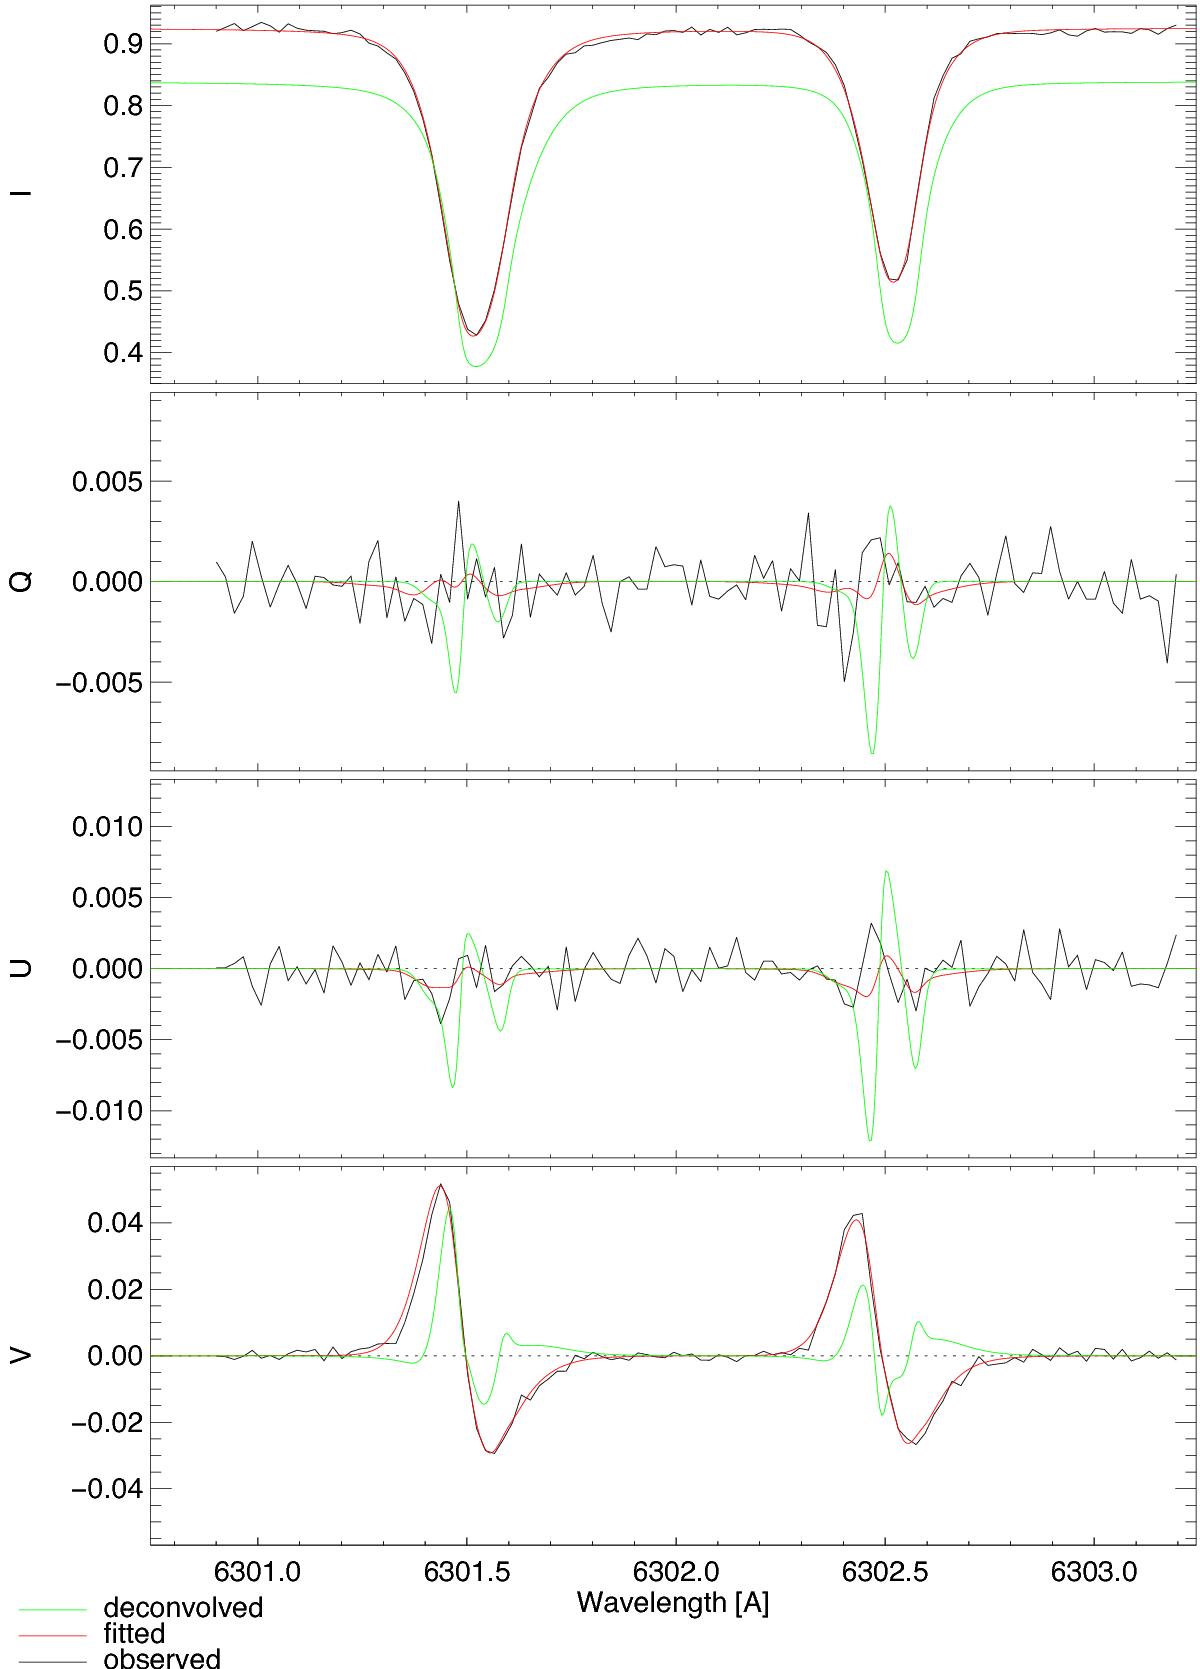
Stokes spectra of a typical canopy pixel harbouring a small opposite polarity magnetic field at log (τ) = 0 and −0.9. The black spectra correspond to the original SOT/SP observation, the red curves display the spectra fitted by the inversion, and the resultant spectra after the spatial deconvolution are coloured green.
Current usage metrics show cumulative count of Article Views (full-text article views including HTML views, PDF and ePub downloads, according to the available data) and Abstracts Views on Vision4Press platform.
Data correspond to usage on the plateform after 2015. The current usage metrics is available 48-96 hours after online publication and is updated daily on week days.
Initial download of the metrics may take a while.