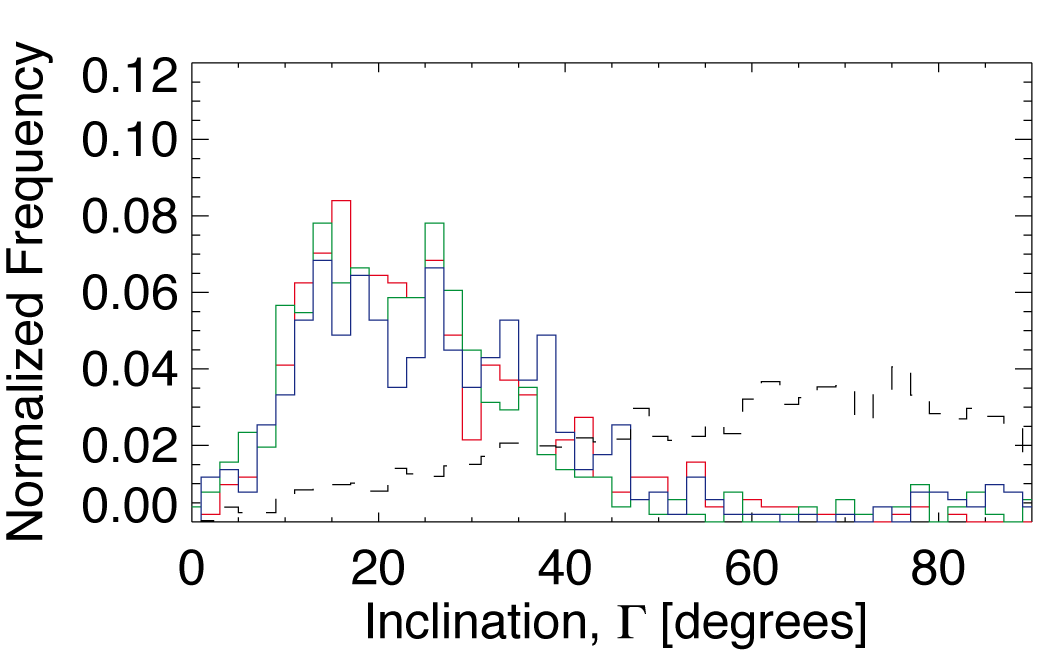
Fig. 19
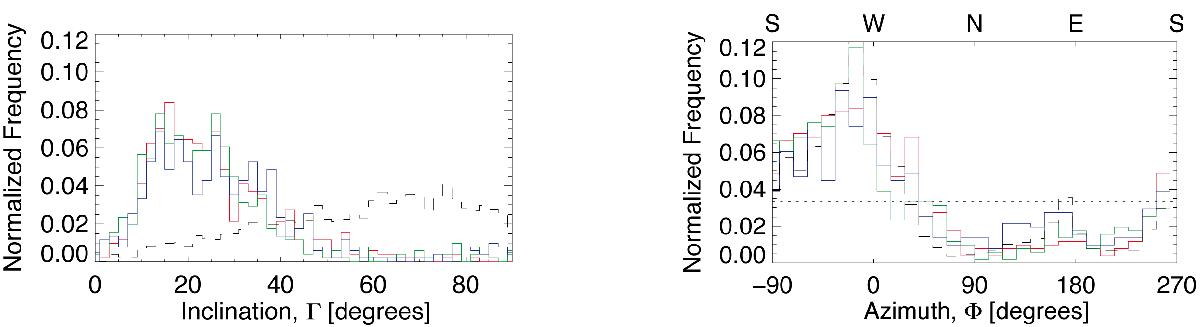
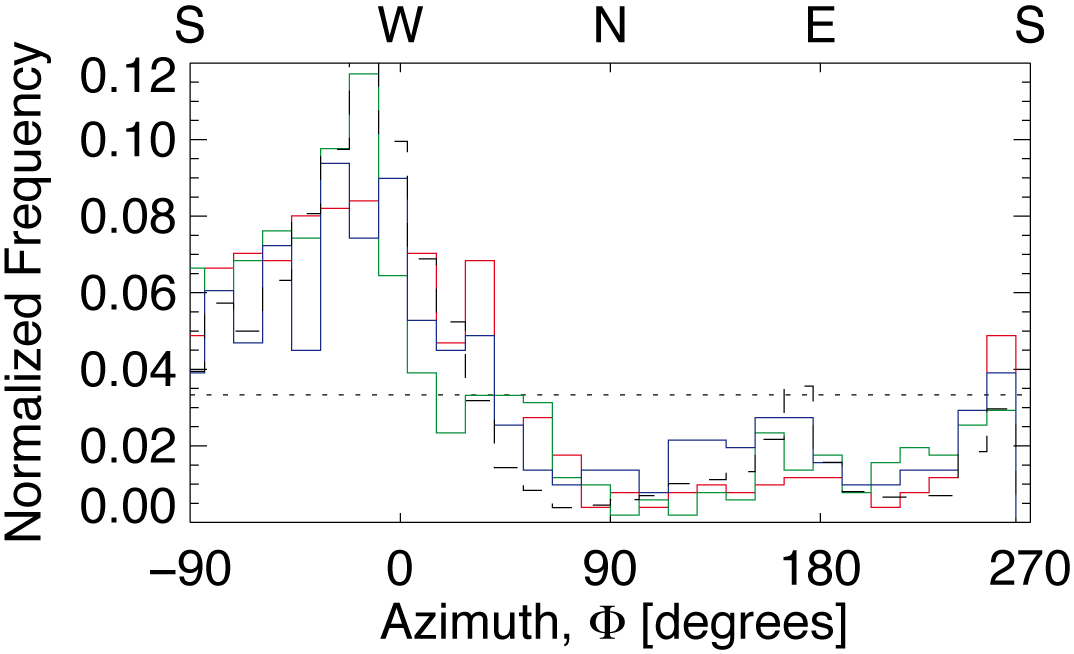
Left: histograms of Γ found in plage around −220X, −170Y. The three coloured histograms were obtained using core pixels, where red refers to log (τ) = 0, green shows to log (τ) = −0.9 and blue refers to log (τ) = −2.3. The dashed histogram represents Γ of canopy pixels at log (τ) = −2.3. Right: histograms of Φ found in plages around −220X, −170Y. The three colours and the dashed line have the same significance as in the graph on the left in this figure. The dotted line represents a homogeneous distribution.
Current usage metrics show cumulative count of Article Views (full-text article views including HTML views, PDF and ePub downloads, according to the available data) and Abstracts Views on Vision4Press platform.
Data correspond to usage on the plateform after 2015. The current usage metrics is available 48-96 hours after online publication and is updated daily on week days.
Initial download of the metrics may take a while.