Fig. 6
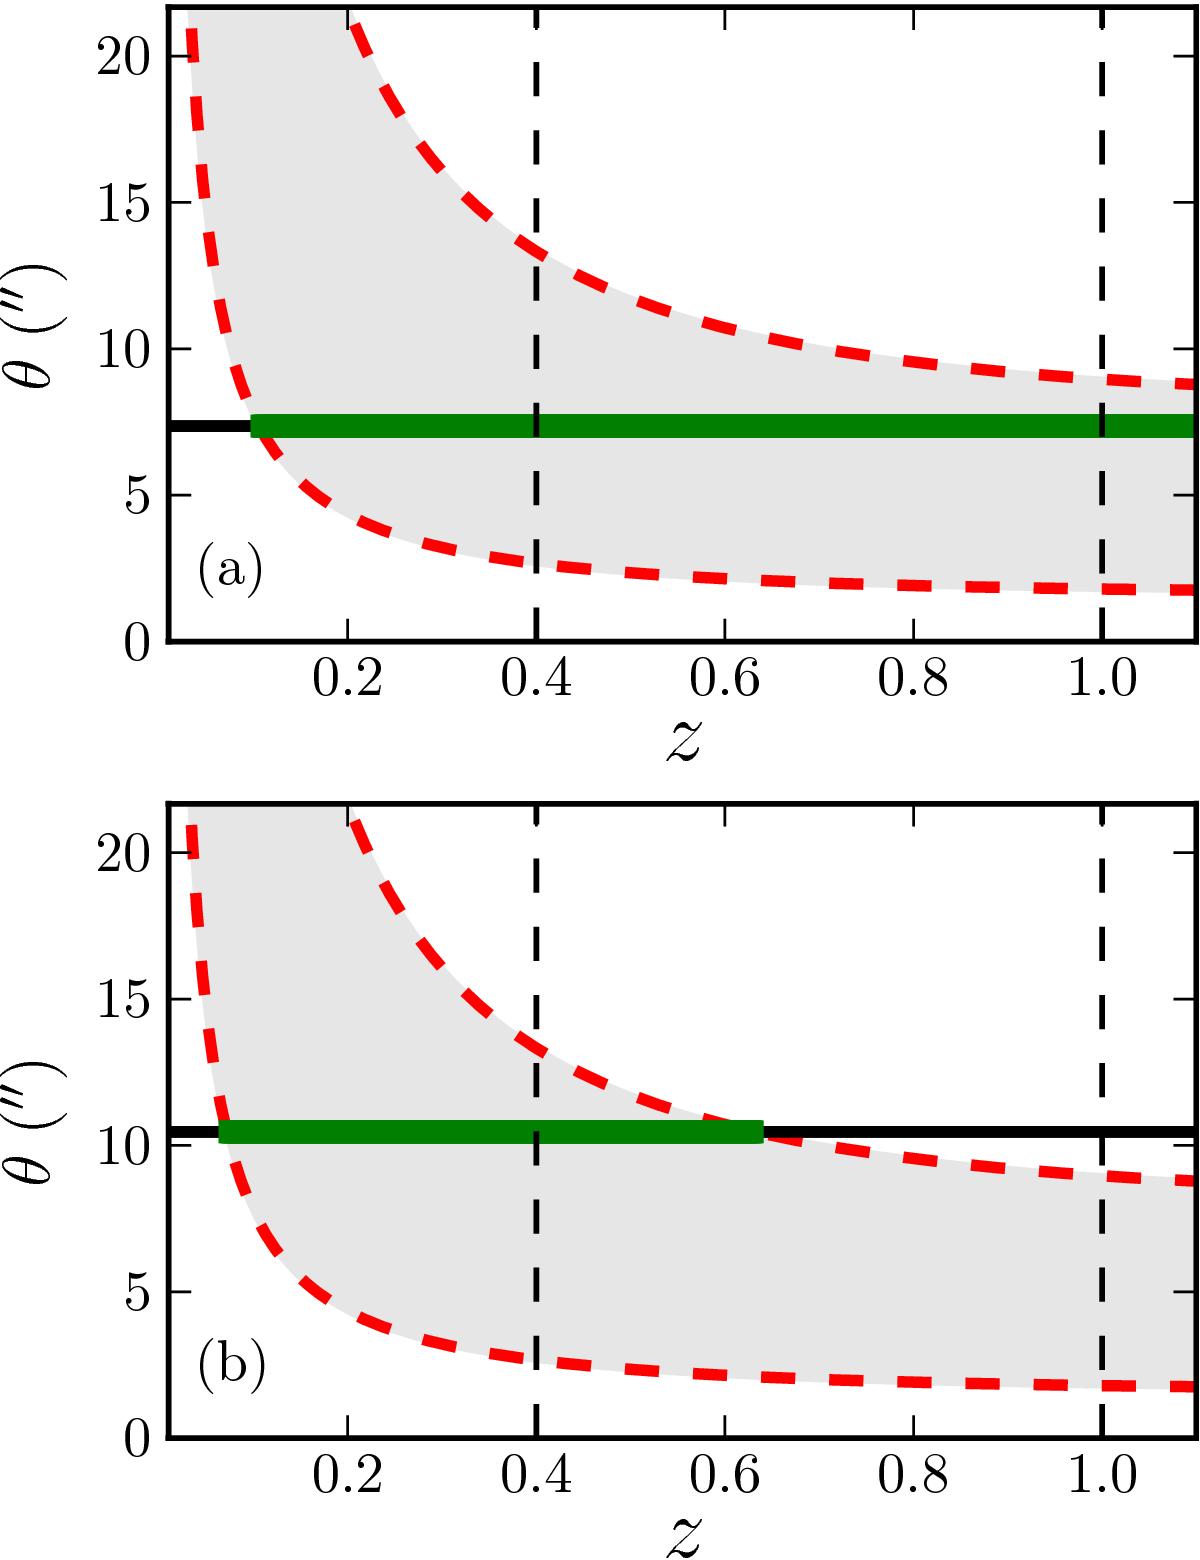
Angular separation θ as a function of redshift. The solid lines mark the measured angular separation of the close pairs, θ = 7.36″ in panel a) and θ = 10.46″ in panel b). The letter in each panel refers to the companion galaxy in Fig. 4. The grey area marks the angular separations between θmin (z) and θmax (z) (red dashed lines). The vertical dashed lines mark the redshift range under study, 0.4 ≤ z< 1. The redshifts at which the angular mask ℳθ is equal to one are marked with the thick green line.
Current usage metrics show cumulative count of Article Views (full-text article views including HTML views, PDF and ePub downloads, according to the available data) and Abstracts Views on Vision4Press platform.
Data correspond to usage on the plateform after 2015. The current usage metrics is available 48-96 hours after online publication and is updated daily on week days.
Initial download of the metrics may take a while.