Fig. 3
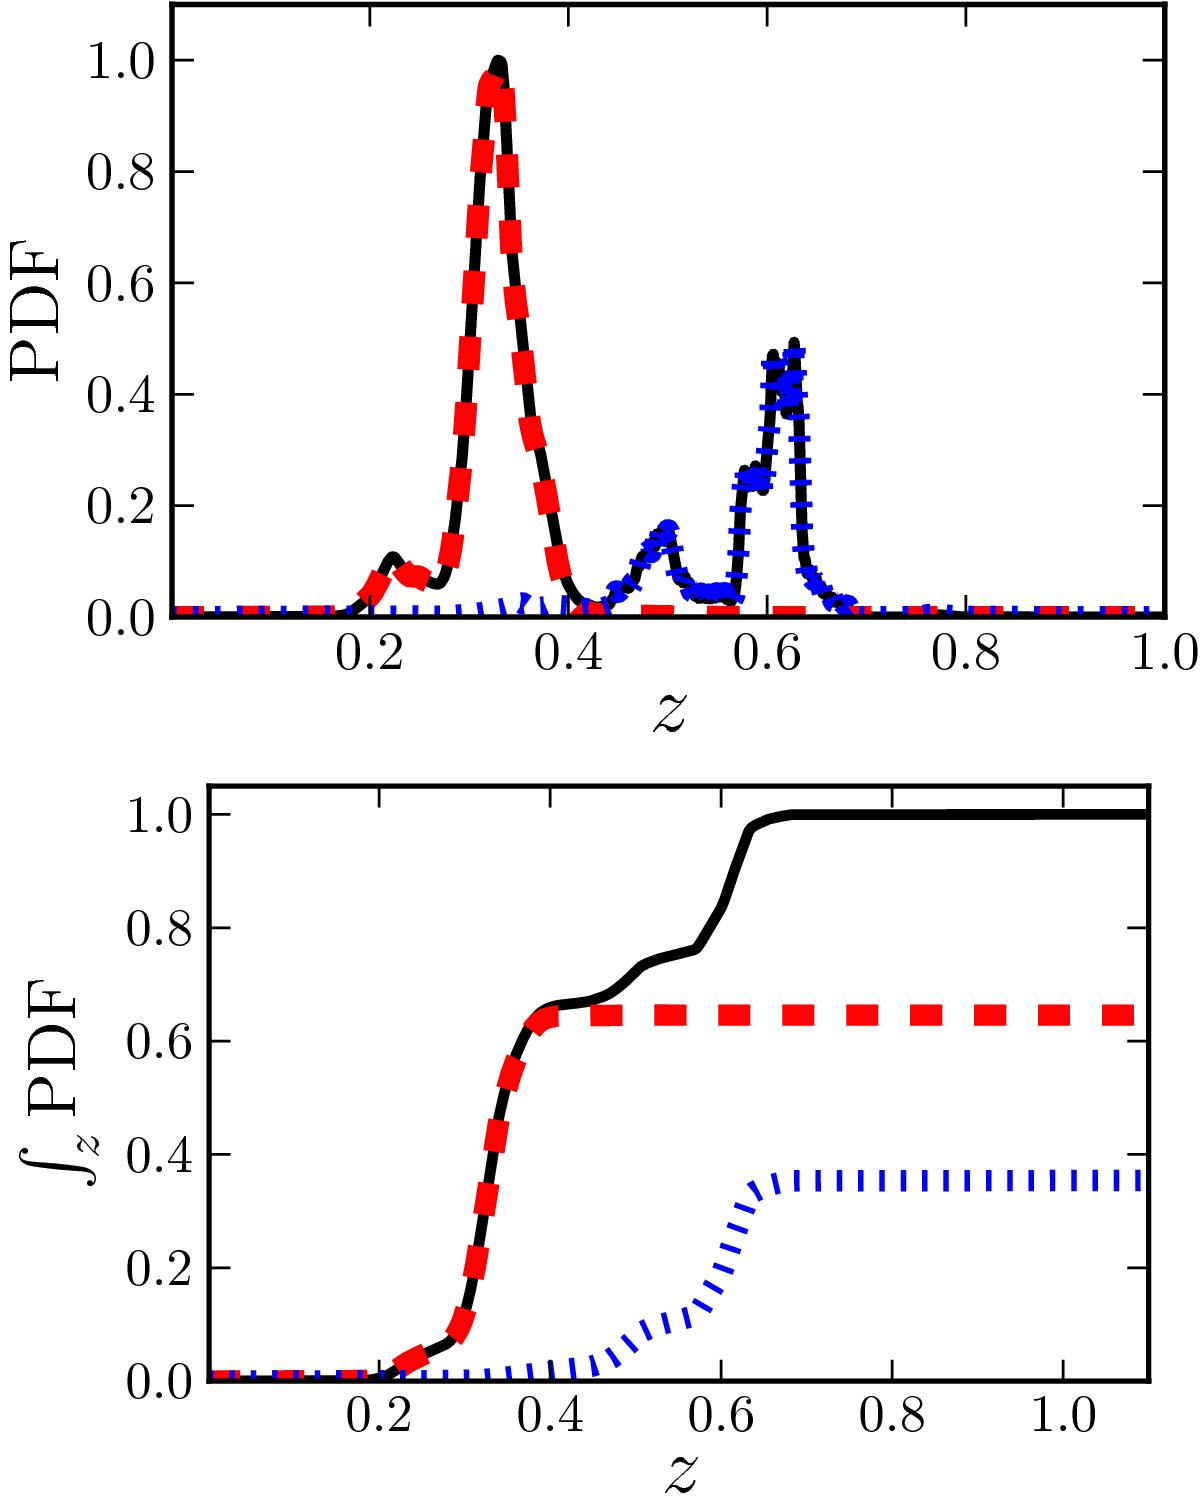
Partial probability distribution functions (top panel) and the cumulative distribution functions (bottom panel) of the source presented in Fig. 1. The black solid lines mark the total PDF, the red dashed lines mark the red templates, PDFred = PDF (z,E/S0), and the blue dotted lines mark the blue templates, PDFblue = PDF (z,S/SB). This galaxy counts as 0.65 red and 0.35 blue in the analysis (bottom panel).
Current usage metrics show cumulative count of Article Views (full-text article views including HTML views, PDF and ePub downloads, according to the available data) and Abstracts Views on Vision4Press platform.
Data correspond to usage on the plateform after 2015. The current usage metrics is available 48-96 hours after online publication and is updated daily on week days.
Initial download of the metrics may take a while.