Fig. 13
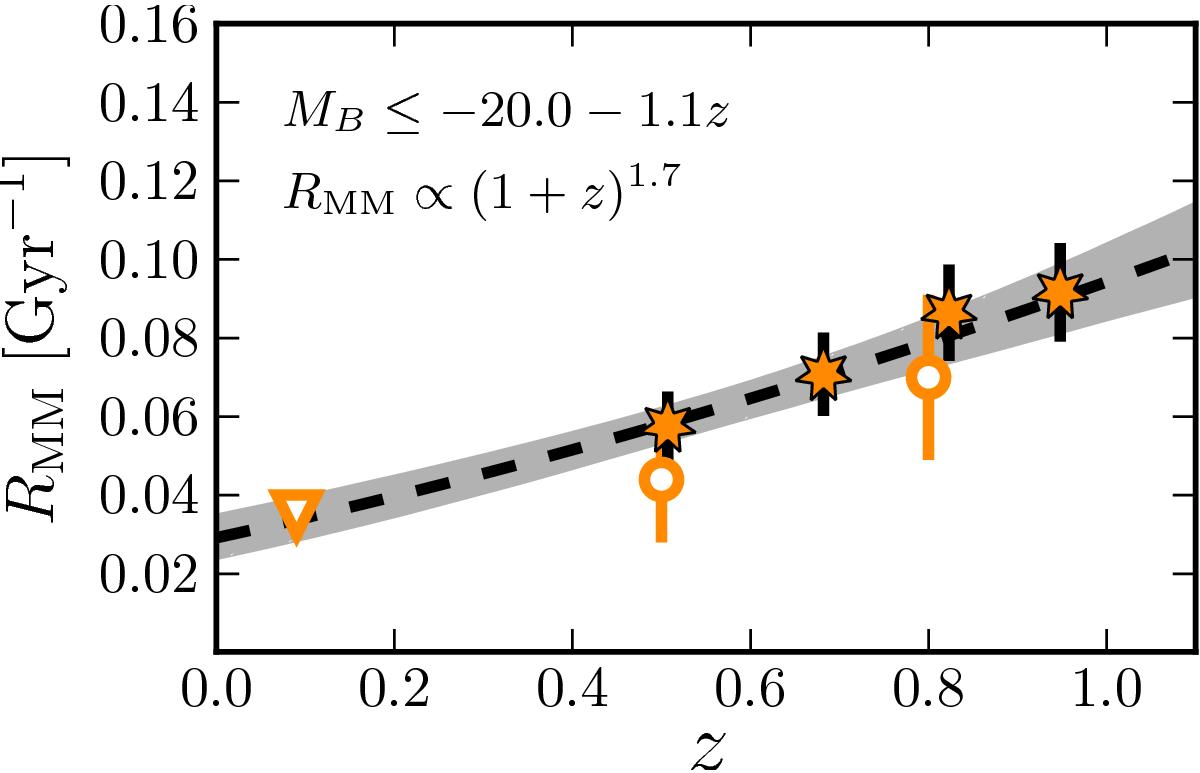
Major merger rate RMM as a function of redshift for MB ≤ − 20 − 1.1z galaxies. The stars are from the ALHAMBRA photometric survey, the circles from the VVDS-Deep spectroscopic survey, and the inverted triangle from the MGC spectroscopic survey. The dashed line is the best fit of a power-law to the data. The power-law index of the best fit is labelled in the panel. The grey area marks the 68% confidence interval of the fit.
Current usage metrics show cumulative count of Article Views (full-text article views including HTML views, PDF and ePub downloads, according to the available data) and Abstracts Views on Vision4Press platform.
Data correspond to usage on the plateform after 2015. The current usage metrics is available 48-96 hours after online publication and is updated daily on week days.
Initial download of the metrics may take a while.