Fig. 11
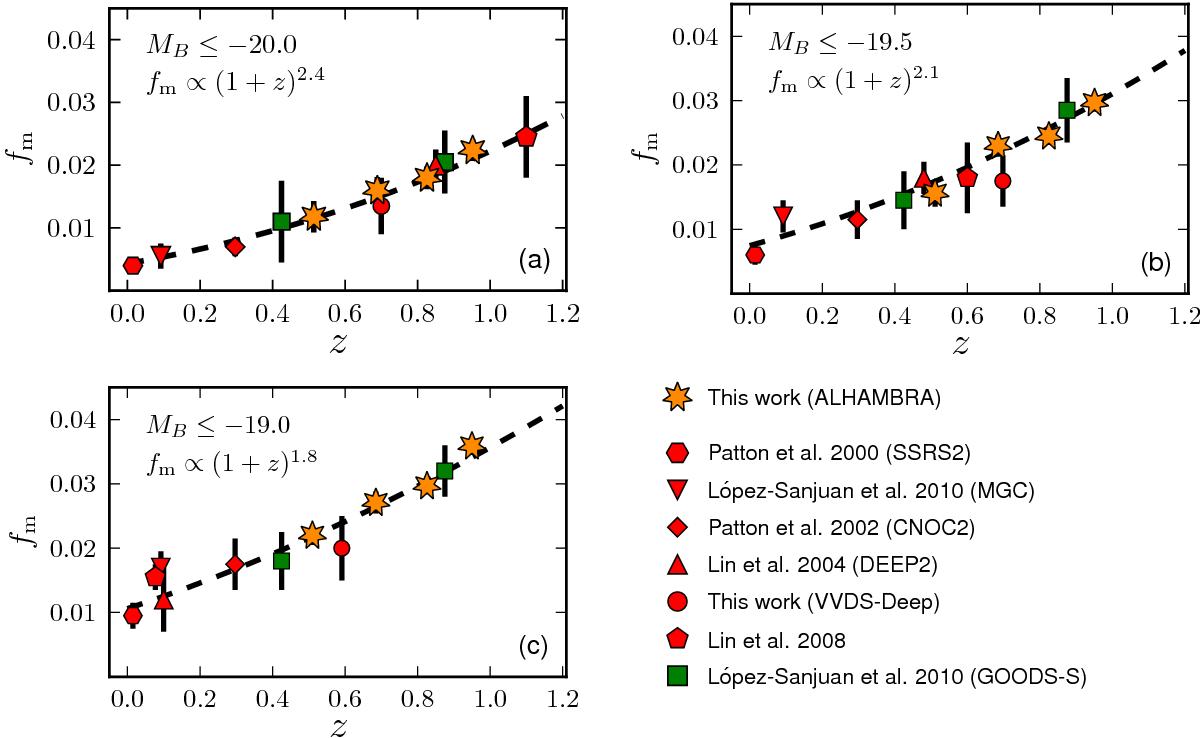
Merger fraction fm as a function of redshift and selection in B band luminosity, panel a) for MB ≤ − 20 galaxies, panel b) for MB ≤ − 19.5 galaxies, and panel c) for MB ≤ − 19 galaxies. The orange stars are from the ALHAMBRA photometric survey (this work), the green squares from spectro-photometric pairs in GOODS-S (LS10), and the red symbols are from spectroscopic surveys: Hexagons from the SSRS2 (Patton et al. 2000), inverted triangles form the MGC (LS10), diamonds from the CNOC2 (Patton et al. 2002), dots from the VVDS-Deep (this work), triangles from the DEEP2 (Lin et al. 2004), and pentagons from Lin et al. (2008). The dashed lines are the best fit of Eq. (25) to the data. The power-law index from the best fit is labelled in the panels.
Current usage metrics show cumulative count of Article Views (full-text article views including HTML views, PDF and ePub downloads, according to the available data) and Abstracts Views on Vision4Press platform.
Data correspond to usage on the plateform after 2015. The current usage metrics is available 48-96 hours after online publication and is updated daily on week days.
Initial download of the metrics may take a while.