Fig. 13
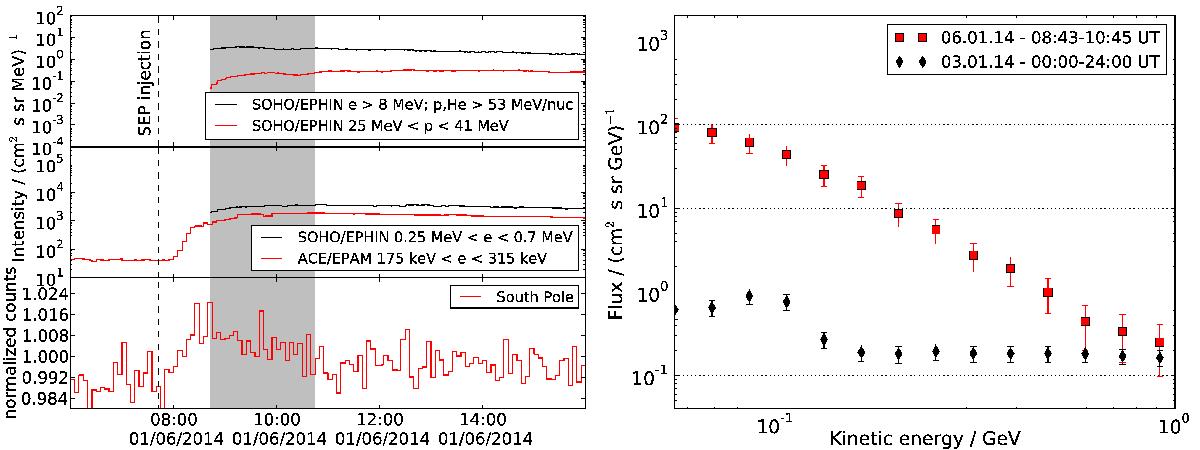
Left: time profile of the event on January 6, 2014. We present the integral channel and protons measured by SOHO/EPHIN (top), electrons measured by SOHO/EPHIN and ACE/EPAM (middle), and neutron monitor count rates. The dashed lines indicates the injection time of SEPs into IP space (07:43 UT). Right: calculated GCR background (black diamonds) and background-subtracted event spectum (red squares).
Current usage metrics show cumulative count of Article Views (full-text article views including HTML views, PDF and ePub downloads, according to the available data) and Abstracts Views on Vision4Press platform.
Data correspond to usage on the plateform after 2015. The current usage metrics is available 48-96 hours after online publication and is updated daily on week days.
Initial download of the metrics may take a while.