Fig. 11
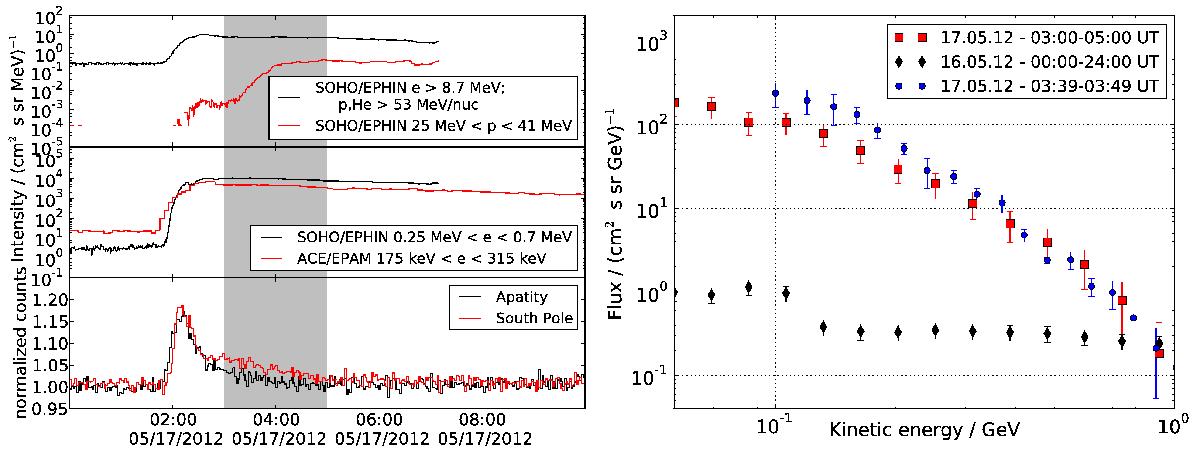
Left: time profile of the GLE in May 2012. We present the integral channel and protons measured by SOHO/EPHIN (top), electrons measured by SOHO/EPHIN and ACE/EPAM (middle), and neutron monitor count rates. Right: calculated GCR background (black diamonds) and background-subtracted event spectrum (red squares). The PAMELA spectrum supplied by Bazilevskaya et al. (2013) is shown for comparison (blue circles).
Current usage metrics show cumulative count of Article Views (full-text article views including HTML views, PDF and ePub downloads, according to the available data) and Abstracts Views on Vision4Press platform.
Data correspond to usage on the plateform after 2015. The current usage metrics is available 48-96 hours after online publication and is updated daily on week days.
Initial download of the metrics may take a while.