Fig. 1
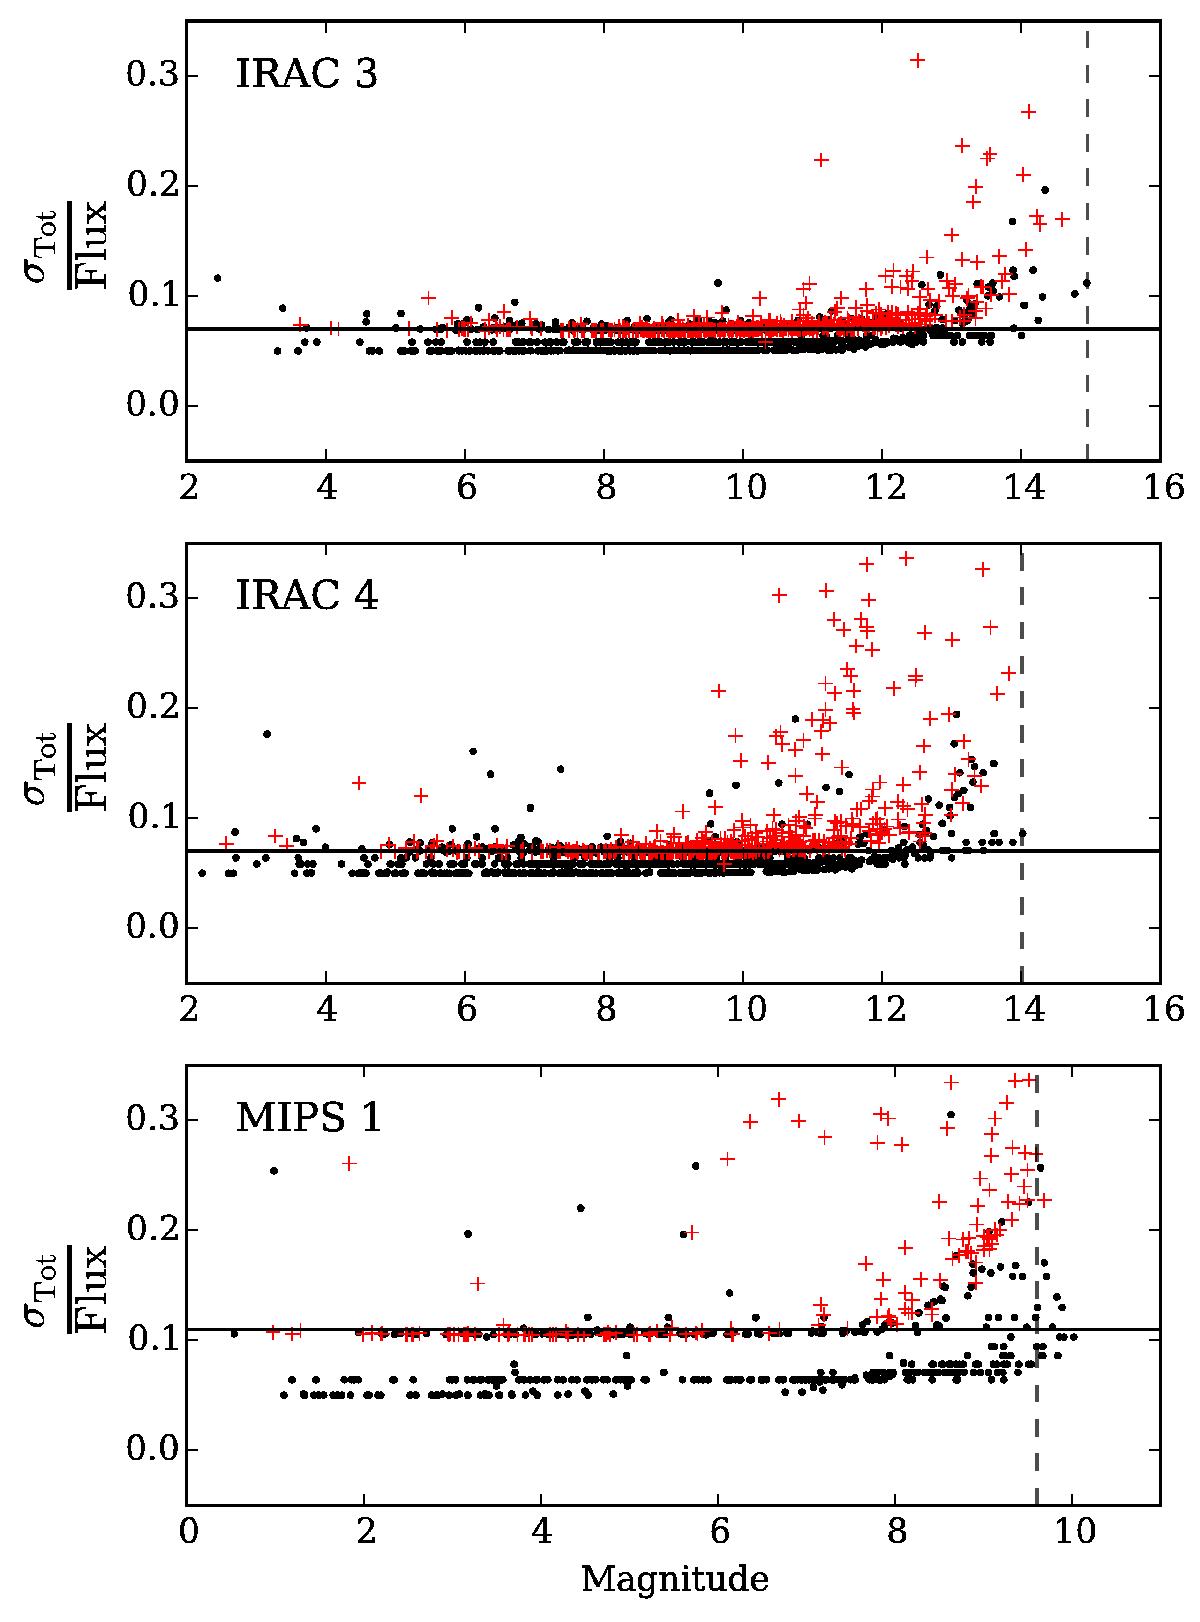
Ratio of the total uncertainty (observational and systematic) over the observed flux as a function of magnitude. IRAC3, IRAC4, and MIPS1 bands are shown. Sources from discarded regions (IC 348 and Ophiuchus) are represented as red crosses, the rest of the sources as black dots. The black solid line corresponds to the homogenized uncertainty levels of 7% (all IRAC bands) and 12% (MIPS1). The black dashed line shows the sensitivity limit for each band, as indicated by the observing programs. Objects falling beyond this limit in the MIPS1 plot are caused by noise (uncertainties in Teff, AV,...) in the corresponding photosphere fit, and were kept in the sample.
Current usage metrics show cumulative count of Article Views (full-text article views including HTML views, PDF and ePub downloads, according to the available data) and Abstracts Views on Vision4Press platform.
Data correspond to usage on the plateform after 2015. The current usage metrics is available 48-96 hours after online publication and is updated daily on week days.
Initial download of the metrics may take a while.