Fig. 6
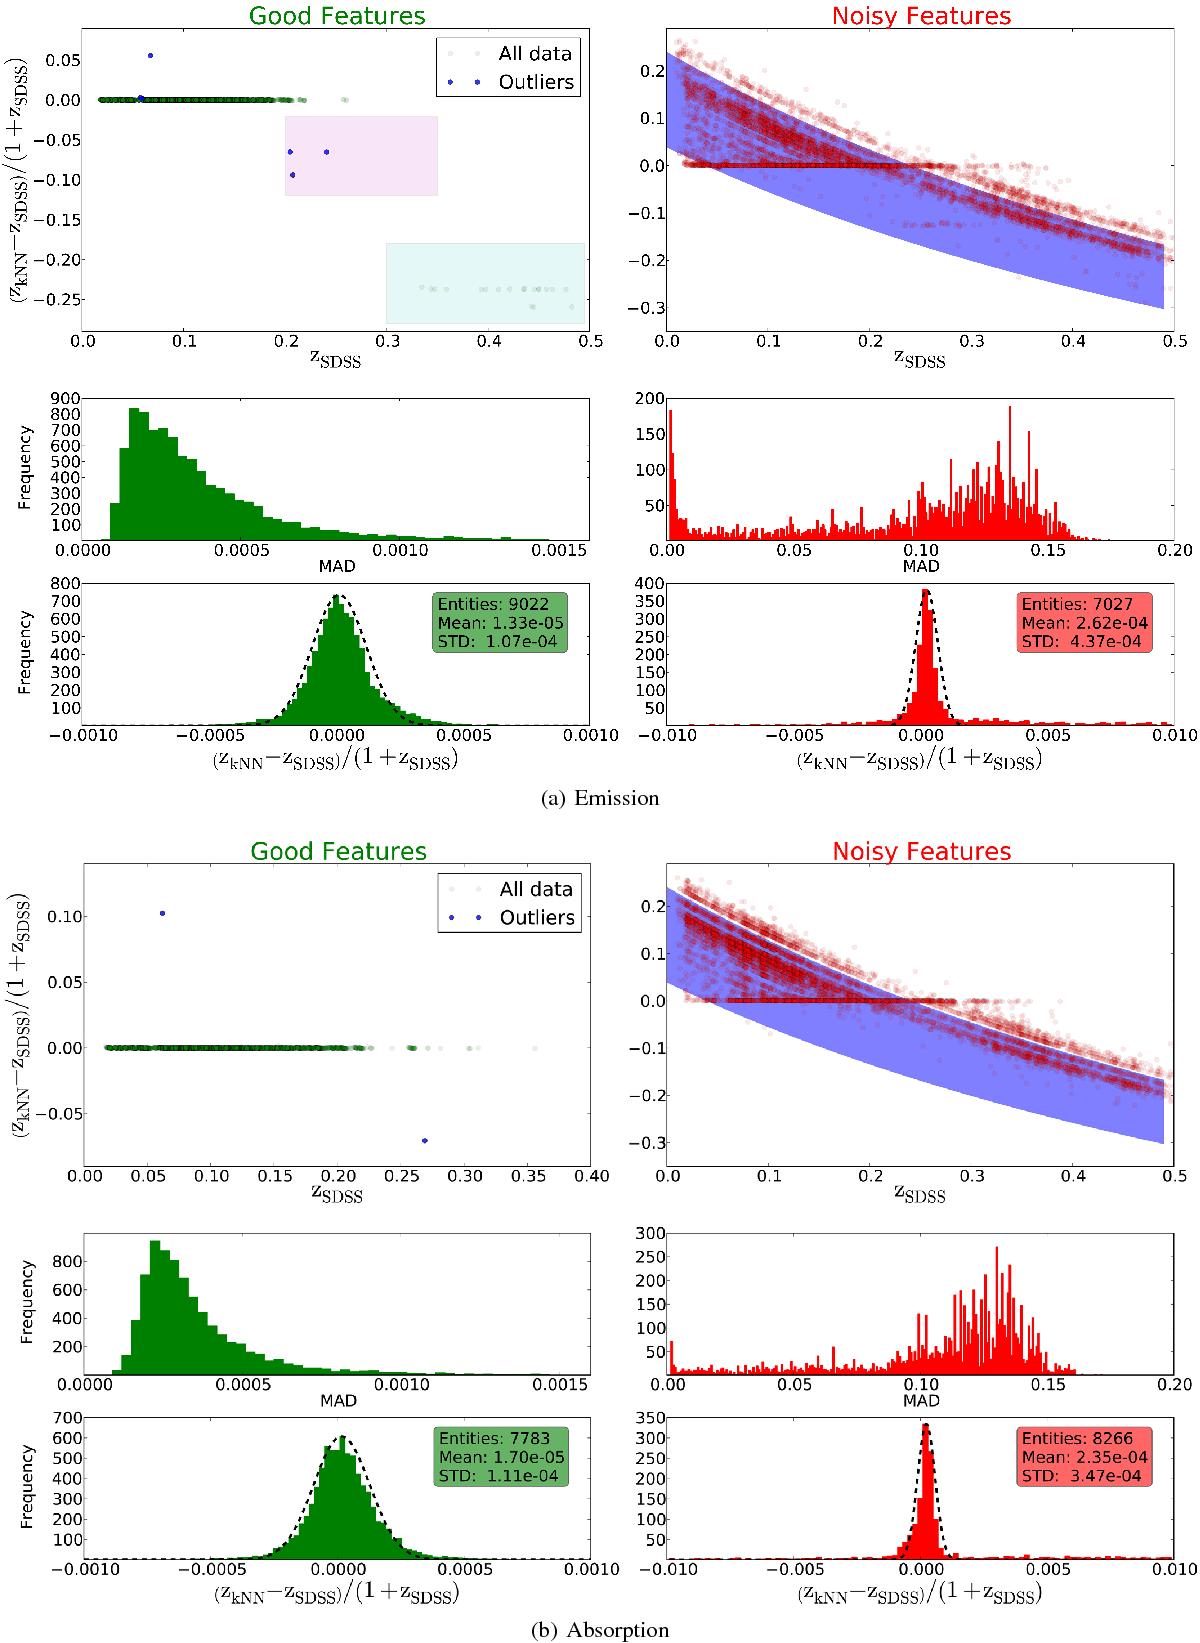
Evaluation of the performance for emission a) and absorption b): the relative deviation from the SDSS redshift as function of the SDSS redshift (top), the distribution of the MAD of the calculated redshift (middle) and the frequency of the relative deviation (bottom) are shown for the good (left) and the rejected noisy (right) spectral features, respectively. The blue background shade in the upper right figure reflects the objects which are entirely dominated by noise and thus their computed redshift just reflects a random draw of redshifts from the initial distribution, see Eq. (9).
Current usage metrics show cumulative count of Article Views (full-text article views including HTML views, PDF and ePub downloads, according to the available data) and Abstracts Views on Vision4Press platform.
Data correspond to usage on the plateform after 2015. The current usage metrics is available 48-96 hours after online publication and is updated daily on week days.
Initial download of the metrics may take a while.