Free Access
Fig. 3
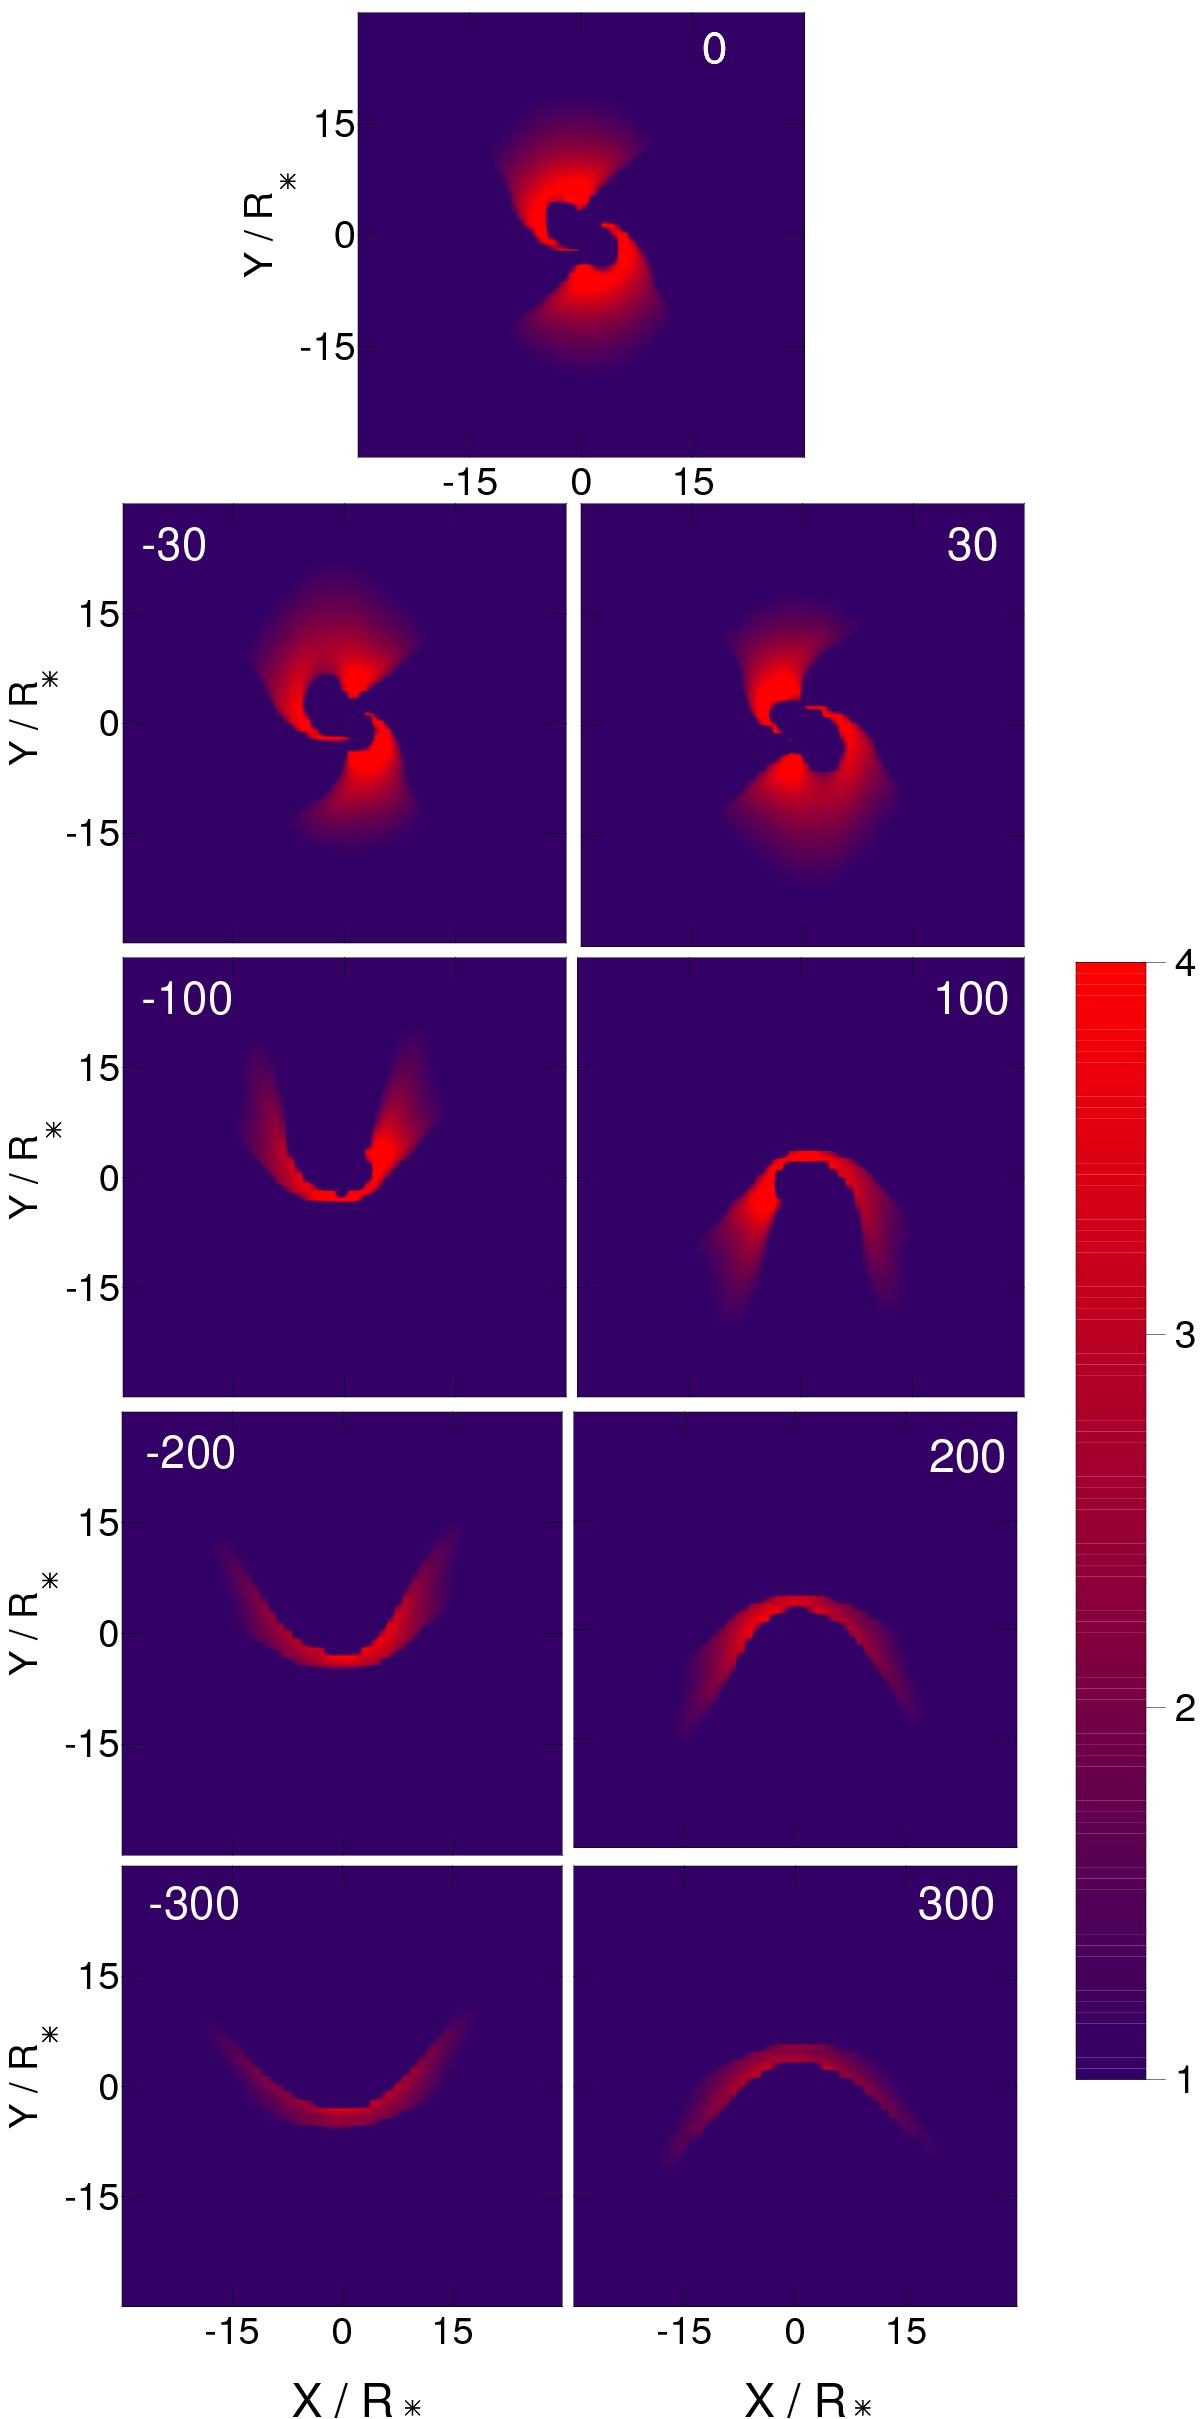
Brγ intensity distribution maps of our best disc wind model MW6 (see Table 3) at several radial velocities, as indicated by the white labels in units of km s-1. Emission from the disc continuum and the central star is not shown. The colours represent the intensity in logarithmic scale in arbitrary units.
Current usage metrics show cumulative count of Article Views (full-text article views including HTML views, PDF and ePub downloads, according to the available data) and Abstracts Views on Vision4Press platform.
Data correspond to usage on the plateform after 2015. The current usage metrics is available 48-96 hours after online publication and is updated daily on week days.
Initial download of the metrics may take a while.