Fig. C.1
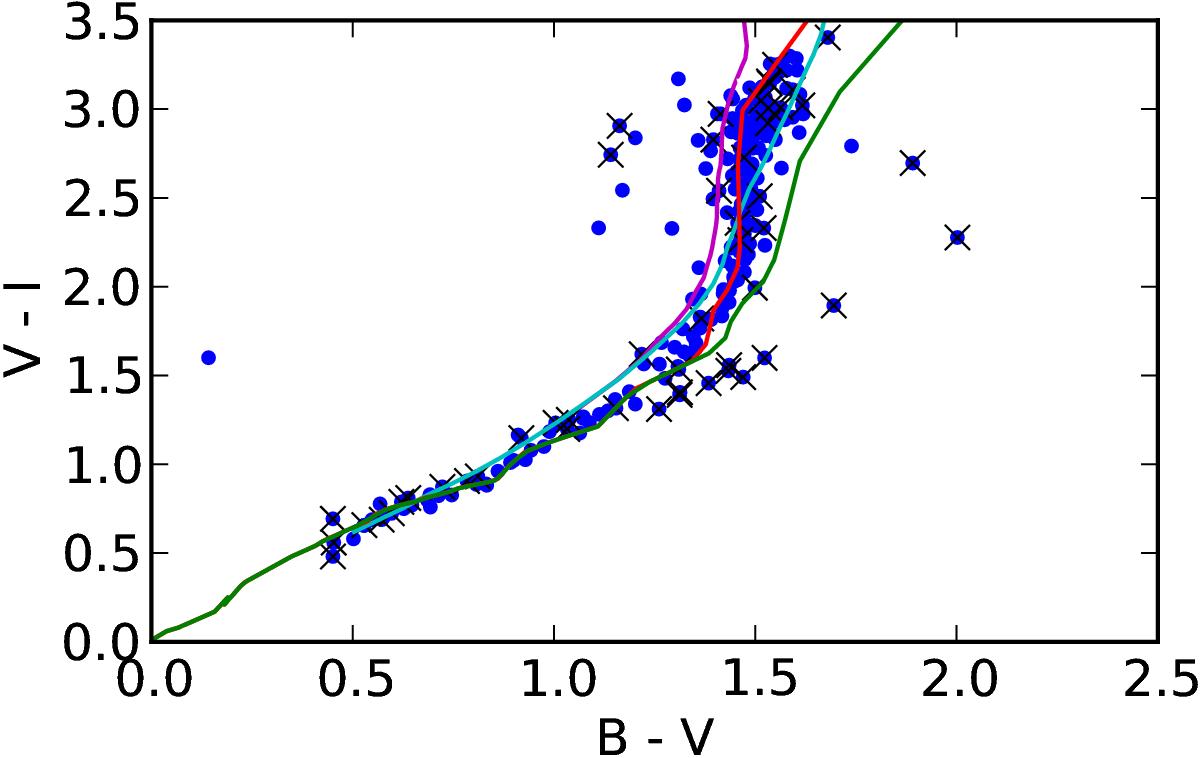
V − I versus B − V colour−colour diagram for probable members of γ Vel. Stars with radial velocities higher than 9 km s-1 from the mean velocity of γ Vel are crossed out. The empirical main-sequence locus relationship from Kenyon & Hartmann (1995) is over-plotted in green, the theoretical main-sequence locus from BT-Settl (Allard et al. 2011) in cyan, the theoretical pre-main sequence locus for an age of 7 Myr from BT-Settl in purple, and finally the locus obtained from Eq. (C.1) in red. All the colour loci plotted as lines have been shifted assuming an extinction of E(B − V) = 0.038 (Jeffries et al. 2009) and E(V − I) /E(B − V) = 1.6 (Rieke & Lebofsky 1985).
Current usage metrics show cumulative count of Article Views (full-text article views including HTML views, PDF and ePub downloads, according to the available data) and Abstracts Views on Vision4Press platform.
Data correspond to usage on the plateform after 2015. The current usage metrics is available 48-96 hours after online publication and is updated daily on week days.
Initial download of the metrics may take a while.