Fig. 10
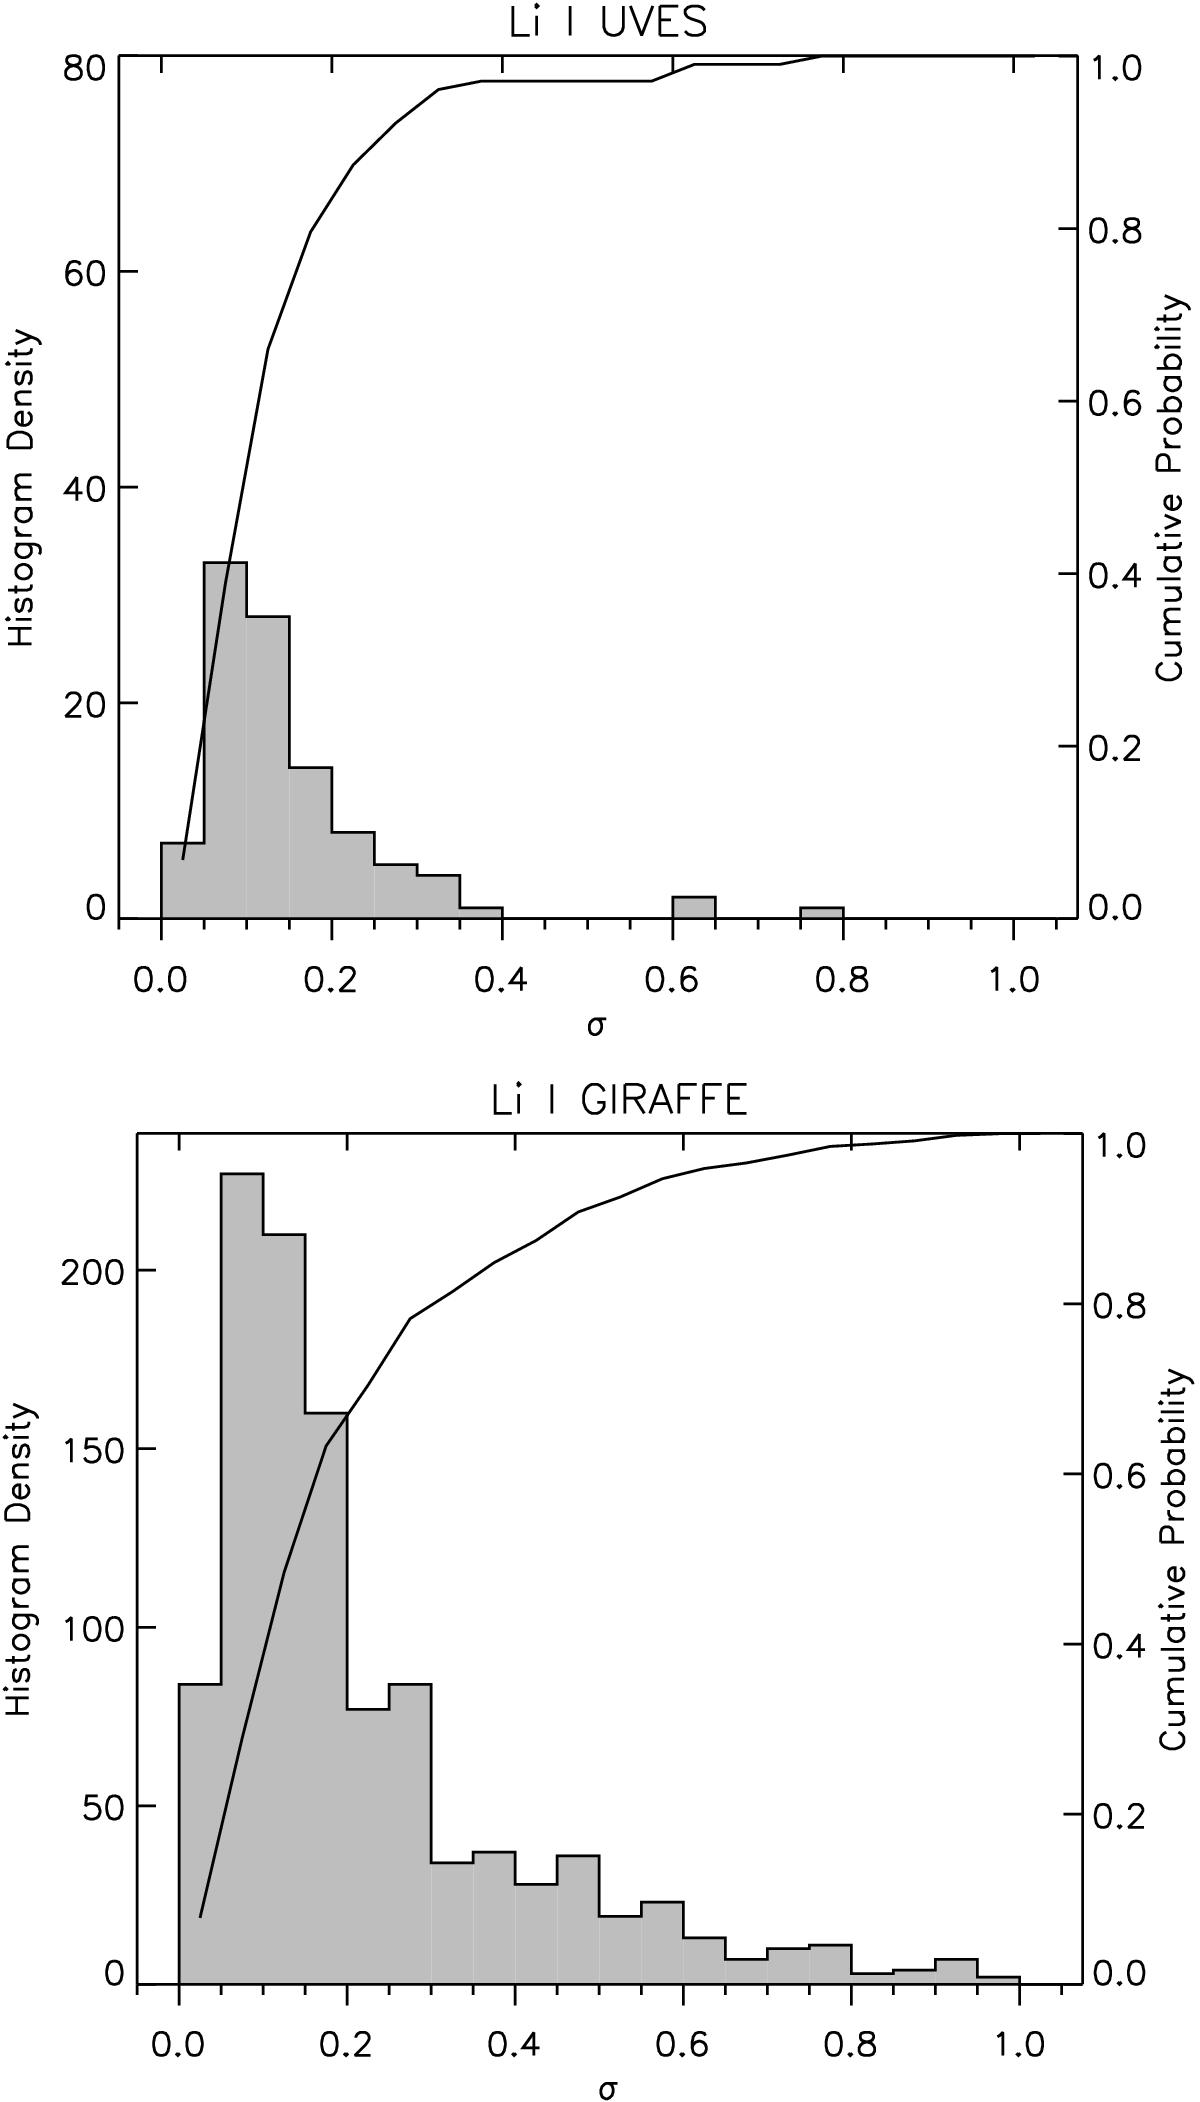
Li abundance uncertainty histogram for all sources in iDR2. For the GIRAFFE spectra the log ϵ(Li) uncertainty is propagated from the uncertainty in Teff and W(Li). For the UVES spectra the node-to-node dispersion is considered. A solid line is used for the cumulative probability (right ordinate axis). See text for details.
Current usage metrics show cumulative count of Article Views (full-text article views including HTML views, PDF and ePub downloads, according to the available data) and Abstracts Views on Vision4Press platform.
Data correspond to usage on the plateform after 2015. The current usage metrics is available 48-96 hours after online publication and is updated daily on week days.
Initial download of the metrics may take a while.