Fig. 4
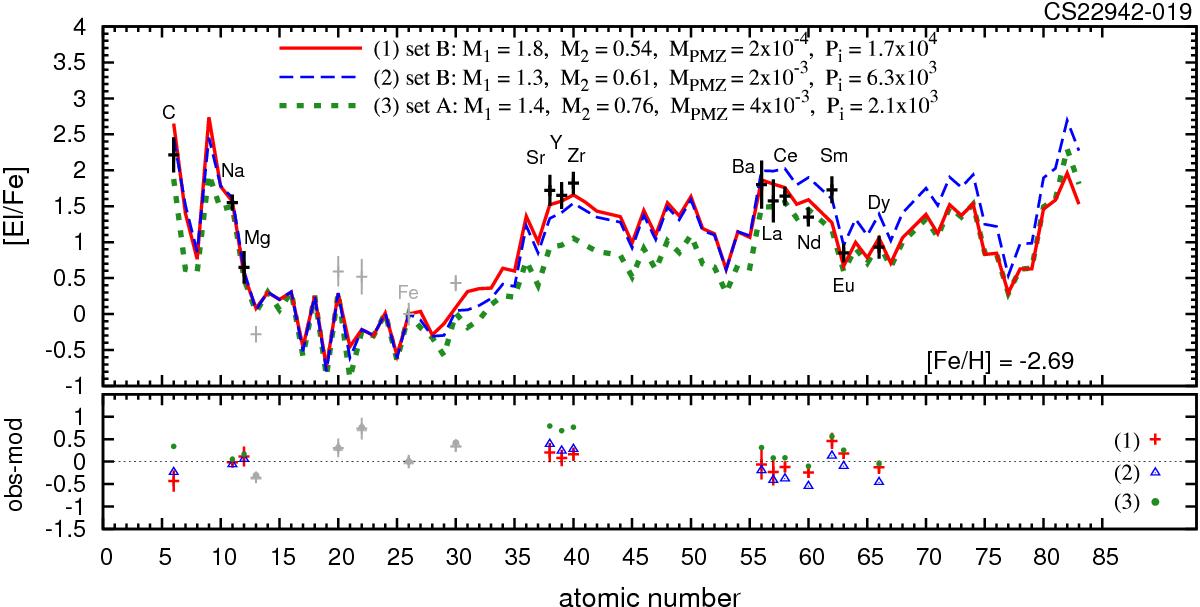
Best fitting model to star CS22942–019. Points with error bars: observed abundances, in black the elements used to determine the best fit and in grey the other elements. Red solid line: the best-fitting model, found with model set B and M1,i = 1.8 M⊙, M2,i = 0.54 M⊙ and MPMZ = 2 × 10⁻⁴M⊙. Blue dashed line: alternative fit with model set B and M1,i = 1.3 M⊙, M2,i = 0.61 M⊙ and MPMZ = 2 × 10⁻³M⊙ (see text). Green dotted line: best fit adopting model set A. Lower panel: the residuals of the three models are shown as red plus signs with error bars, blue triangles, and green dots, respectively.
Current usage metrics show cumulative count of Article Views (full-text article views including HTML views, PDF and ePub downloads, according to the available data) and Abstracts Views on Vision4Press platform.
Data correspond to usage on the plateform after 2015. The current usage metrics is available 48-96 hours after online publication and is updated daily on week days.
Initial download of the metrics may take a while.