Fig. 7

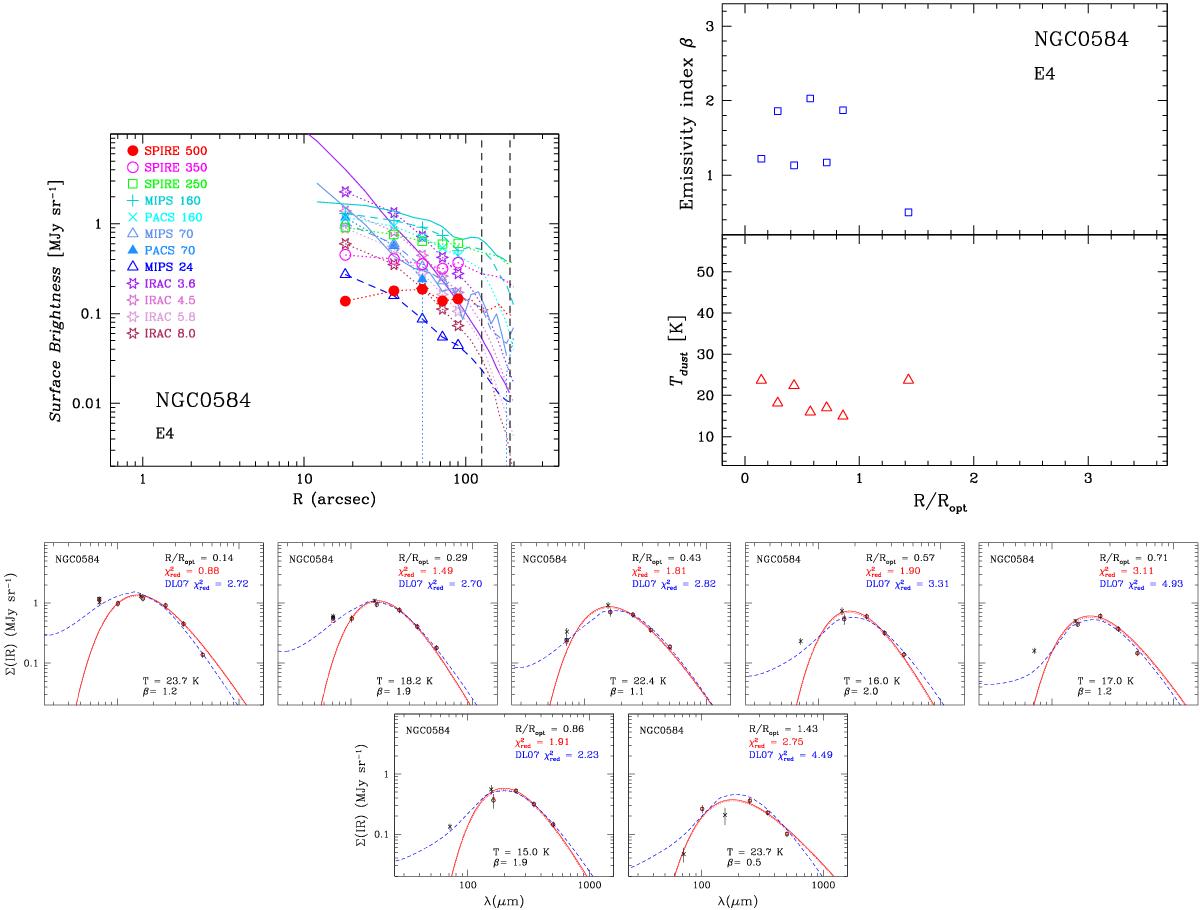
NGC 584 (E4) radial profiles. Top left panel: observed surface brightness profiles, ΣIR, for PACS, MIPS, SPIRE, and IRAC 3.6 μm shown in log-log space. Symbols distinguish the different wavelengths for radial bins ≤100′′. The vertical dashed lines illustrate Ropt and 1.5 Ropt. The solid curves give the radial profiles at 3.6 μm, 24 μm, 70 μm, and 160 μm from Muñoz-Mateos (priv. comm.) which were not convolved to the MIPS 160 μm resolution as are the profiles presented here. Top right panel: MBBV radial temperature trends Tdust and emissivity index trends β vs. normalized radii, R/Ropt. Sets of fluxes to fit are defined over ≥4 wavelengths. The bottom panels show each MBBV SED fit as a (red) solid line, ΣIR vs. wavelength, with best-fit temperature and emissivity index β. Herschel data are shown as open circles and (red) squares with squares corresponding to the calibration corrections inferred from the MBB fits; MIPS data are shown as ×. As discussed in the text, neither the 70 μm nor the 500 μm data points are included in the MBB fits. Also shown are the best-fit DL07 models as a (blue) dashed line. ![]() values are given for both fits in the upper right corner of each plot.
values are given for both fits in the upper right corner of each plot.
Current usage metrics show cumulative count of Article Views (full-text article views including HTML views, PDF and ePub downloads, according to the available data) and Abstracts Views on Vision4Press platform.
Data correspond to usage on the plateform after 2015. The current usage metrics is available 48-96 hours after online publication and is updated daily on week days.
Initial download of the metrics may take a while.


