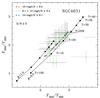
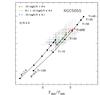
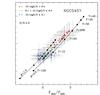
Fig. 6
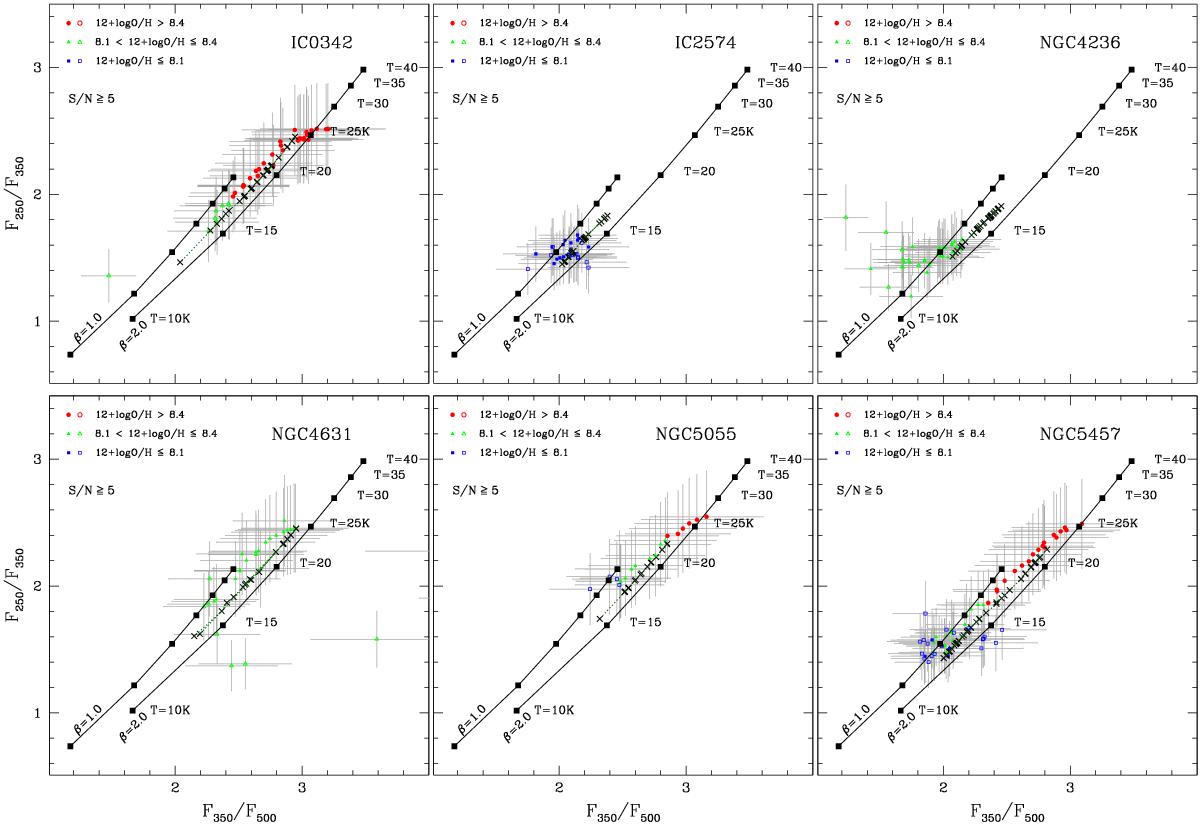
SPIRE colors of individual galaxies with more than 30 radial data points. Data are distinguished by O/H with (red) circles showing 12 + log (O/H)>8.4, (green) triangles 8.0 <12 + log (O/H)≤ 8.4, and (blue) squares 12 + log (O/H)≤ 8.1. Filled symbols correspond to positions with normalized (to optical radius Ropt) radii within R/Ropt≤ 0.8, and open symbols to larger radii. DL07 best-fit models for the data are shown with ×, connected by a dotted line. In all panels, MBB fits are given for two values of emissivity index β: β = 1.0 (dotted line) and β = 2.0 (solid line). Temperatures are also labeled from Tdust = 15 K to Tdust = 40 K.
Current usage metrics show cumulative count of Article Views (full-text article views including HTML views, PDF and ePub downloads, according to the available data) and Abstracts Views on Vision4Press platform.
Data correspond to usage on the plateform after 2015. The current usage metrics is available 48-96 hours after online publication and is updated daily on week days.
Initial download of the metrics may take a while.