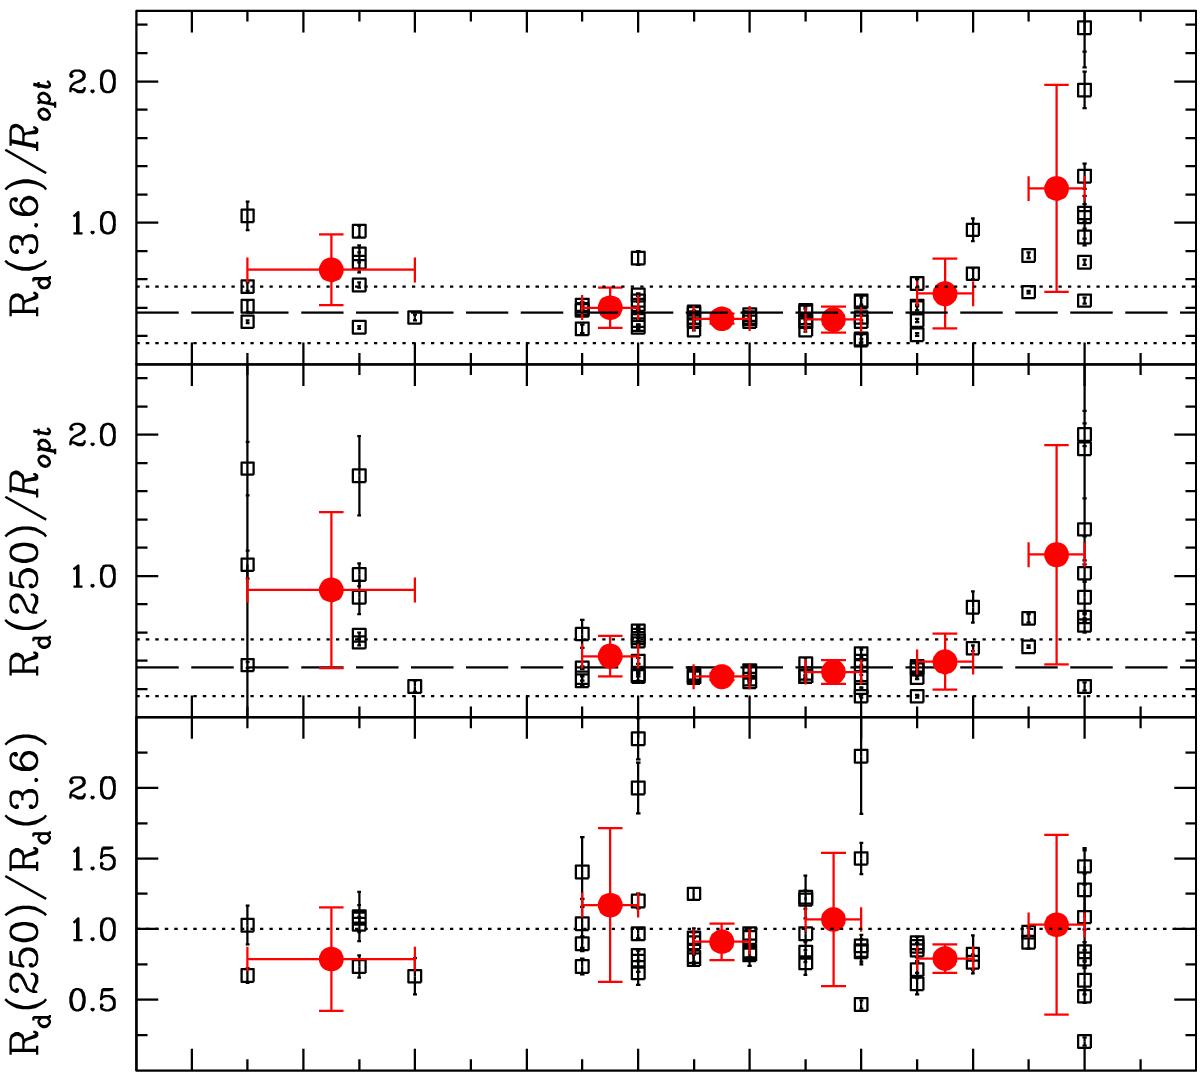
Fig. 3

Disk scalelengths normalized to Ropt as a function of Hubble type T. The top panel shows the individual 3.6 μm scalelengths Rd3.6, the middle the individual 250 μm scalelengths Rd250, and the bottom their ratio. In each panel, the large circles with error bars report the means over a small range of Hubble types as indicated by the horizontal error bars; the vertical error bars are the standard deviations. The horizontal dashed lines in the top two panels show the mean scalelength obtained by averaging over spirals only (1 ≤ T ≤ 5); the dotted lines show the range from 0.25 to 0.45. In the bottom panel, the dotted line shows a scalelength ratio of unity.
Current usage metrics show cumulative count of Article Views (full-text article views including HTML views, PDF and ePub downloads, according to the available data) and Abstracts Views on Vision4Press platform.
Data correspond to usage on the plateform after 2015. The current usage metrics is available 48-96 hours after online publication and is updated daily on week days.
Initial download of the metrics may take a while.


