Fig. 11
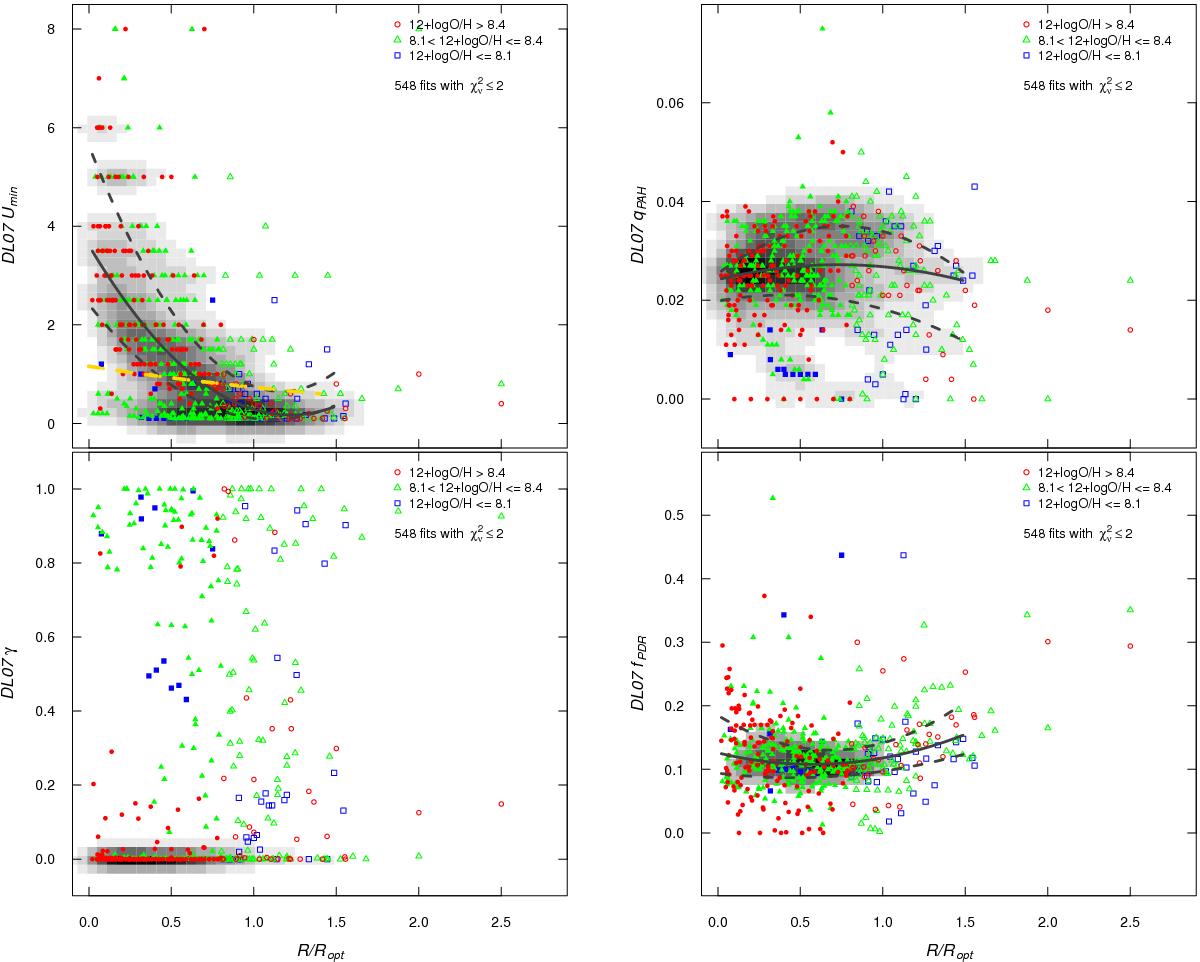
Best-fit DL07 parameters plotted against normalized galactocentric distance. The upper left panel shows Umin; the upper right qPAH; the lower left γ; and the lower right PDR fraction fPDR. The underlying grayscales in each panel show the two-dimensional density distributions of the data. The upper left and right panels show the mean (solid curve) and quartiles (dashed curves) of Umin (upper left), qPAH (upper right) and fPDR (lower right). The (yellow) long-dashed curve in the upper left panel shows the relation for Umin =U0 (Tdust/T0)(4+β) for U0 = 0.93, T0 = 22 K, and β = 1.8 as described in the text. As in previous figures, (red) circles correspond to 12 + log (O/H)> 8.4, (green) triangles to 8.1 <12 + log (O/H)≤ 8.4, and (blue) squares to 12 + log (O/H)≤ 8.1; filled symbols indicate R/Ropt< 0.8.
Current usage metrics show cumulative count of Article Views (full-text article views including HTML views, PDF and ePub downloads, according to the available data) and Abstracts Views on Vision4Press platform.
Data correspond to usage on the plateform after 2015. The current usage metrics is available 48-96 hours after online publication and is updated daily on week days.
Initial download of the metrics may take a while.