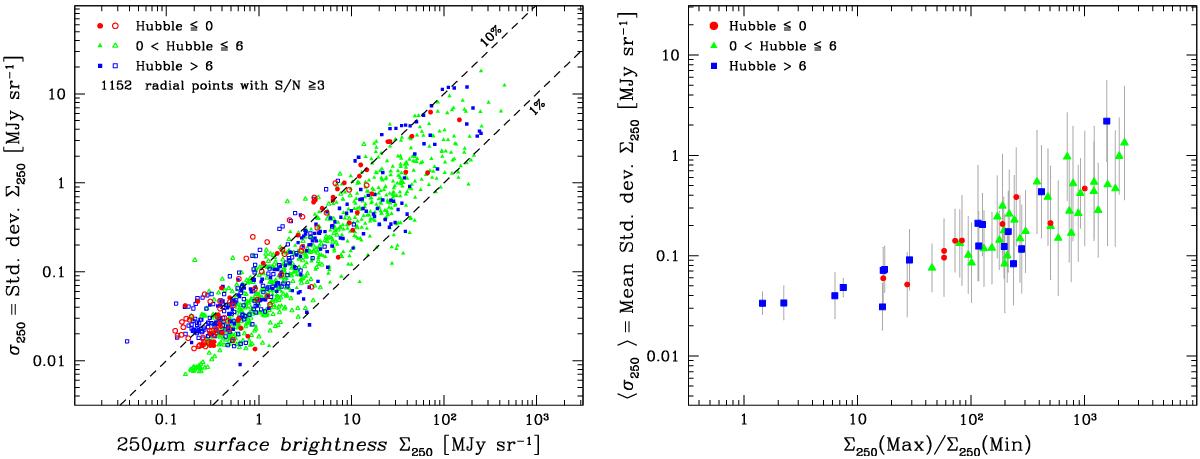
Fig. 1

Standard deviation σ250 of the 250 μm surface brightness within an annulus vs. 250 μm surface brightness Σ250 in the annulus (left panel), and the mean σ250 over all the profiles in a galaxy vs. the ratio of maximum and minimum Σ250 in the galaxy (right panel). Only radial points with S/N ≥ 3 are shown. In the left panel, the dashed lines correspond to 10% variation (upper) and 1% variation (lower) relative to Σ250. The error bars in the right panel reflect the standard deviation within a given profile. In both panels, points are plotted by Hubble type with (red) circles corresponding to early types (T ≤ 0), (green) triangles to spirals (0 <T ≤ 6), and (blue) squares to late types (T> 6); in the left panel filled symbols correspond to R/Ropt≤ 0.8 and open ones to larger radii.
Current usage metrics show cumulative count of Article Views (full-text article views including HTML views, PDF and ePub downloads, according to the available data) and Abstracts Views on Vision4Press platform.
Data correspond to usage on the plateform after 2015. The current usage metrics is available 48-96 hours after online publication and is updated daily on week days.
Initial download of the metrics may take a while.


